DAY 3
Wednesday, 30th November
Informal Statistics
On 30th November we had a workshop about statistics, what is statistics, why we use it and in which field and how.
What is the statistic?
- The statistic is the science that collect, organized and interprets data, that is, it is a data
The word statistics has 3 meanings that can cause confusion:
- To refer to statistical information
- To allude to the set of techniques and methods that are used in the analysis of statistical information.
- In singular and masculine, it refers to a measure derived from a sample.
Nowadays, the statistical analysis is used to make ‘’x-rays’’ of the demographic and social situation of a country, as well as predictions of how its population will evolve in the next years.
It is employed by a multitude of professions in fields as diverse as medicine, architecture, market research, methodology, biology and politics.
What areas of the social science will statistics help?
In education, psychology, sociology, economy, demography, public administration, humanities, legal science.
Statistical culture
- Capacity and knowledge that and individual or social group must have, to understand and analyse data and statistical information
- What is it intended to provide refers to two interrelated components:
- Ability to interpret and critically evaluate statistical information.
- Ability to discuss and express opinions with regard to statistical information.
- Knowledge and skills
- Statistical reasoning
- Intuitions
- Attitudes
Statistics reasoning
- To produce a better understanding within a particular context
- Components:
- Recognize the ned for data
- Trans numeration.
- Perception of variation
- Reasoning with statistical models
- Integration of statistical and context
Statistics language: Key concepts
We can analyse anything. Limited population and unlimited population. Usually when we analyse population, we work on sampled: Small parts from the population. A sub-group which will represent the whole population.
- Representation
- Refers to features of elements of selected for sample that must be similar to those of the entire population.
- It depends mainly on two factors:
- Sample size. Number of surveys applied
- Selection of the sample. The methods of choosing survey respondents.
- Size sample
- n: size of the sample we want to calculate.
- N: Size of the universe
- Z: Deviation from the average level we accept to archieve the level of trust. The most common are:
- 90%->Z=1,645
- 95%->Z= 1,96
- 99%->Z=2,575
- e: Maximum error margin we admit
- p: Proportion we hope to find.

Types of the sampling
Non probalistic/Probalistic
Non probalistic:
- At trial
- For convenience
- Snowball
- For instalments
- Simple random
- Systematic
- Stratified
- By clusters.
Qualitative attribute or categorical
- Nominal
- Ordinal
- Qualitative or numerical
- Discreet
- Continuous
Sociological investigation Center (cis)
- It is an autonomous organism under the Ministry of the Presidency
- The CIS gathers the necessary data for the investigation in very diverse fields, from the evolution of the public opinion to applied research.
Statistical database: Eurostat
- It is the statistical office of the European Commission, which produces data on the European Union.
- Produces economic data in order to support the decisions of the European Central Bank.
- Official website: www.ec.europa.eu
Stages of a statistical study: Problem proposal
- Inquire about the phenomenon to be studied.
- Define aims.
- Formulation of hypothesis.
- Delimit the universe or population to study.
Stages of a statistical study: Fieldwork planning
- Fieldwork design.
- Characteristics of the sample.
- Design of the tool for obtaining of data.
Data collection techniques:
- Surveys.
- Interviews.
- Observation.
- Systematic search of information in which the investigator asks the survey respondents about the data that he wants to obtain.
- All interviews should be asked the same questions, in the same order and in similar situations.
Questions
- Basic element of a questionnaire.
Parts of the questionnaires:
- Identification of the organism conduction the investigation
- Full title of the study.
- Informed consent and confidentiality of the data
- Thankful phrases to the survey respondent.
- Battery of questions.
Basic rules for making questions:
- It should have some usefulness for research or study.
- The answer most be direct.
- They should not incite a particular response.
- Must be clear.
- They must answer a single idea.
- Short and concise.
- Specific.
- Avoid technical words, abbreviations or acronyms. Simple language. Adept language.
- Avoid questions that require recalculation or memory efforts.
Characteristics of the interviewer:
- You must know the subject in depth.
- Ask clear questions.
- Interpret the information appropriately.
- Sensitivity to catch lies.
- Do not issue/have an opinion.
- Do not suggest any answer.
- Motivate participation.
Analysis of data
Types of statistical analysis:
- Descriptive:
- Organize and summarize the data to extract the relevant information
- Inferential:
- Enables generalization of results.
Descriptive data includes: Data counting, Sorting of data, boards, graphics and settings
Inferential data includes: Estimate and hypothesis testing.
Interpretation and preparation of the report
- The interpretation of the results allows to verify if the extracted conclusions are coherent.
Family Track Map on Google Earth
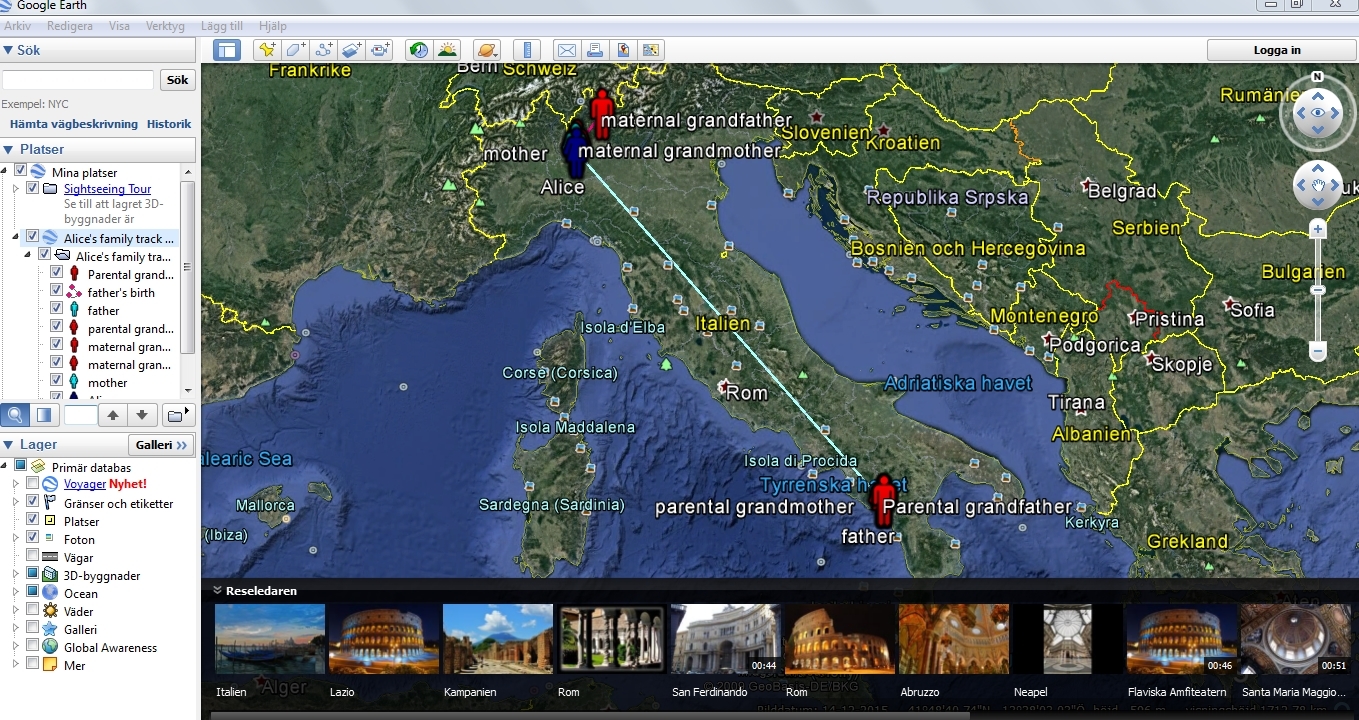
Google Earth is a tool that you can use to look around the globe. We used that tool to track where our family come from and the journey that they did from where they were born to where their children (us) were born.
We’ve had a presentation about a Family Track Map presented by a professor from Alicante University. He spoke about how to use Google Earth as a tool and to locate where our parents and grandparents come from. He said that the Family Track Maps could be either Global, Continental, National, Local. In the picture we see an example that shows a National level of Family Track Map.
The tool here is that first you put a pin from where you paternal grandmother and father is and the same with the maternal. After that you draw lines between them as in Alice’s example. When you’re done with those lines you put a pin down at the location where you parents were born and draw a line from their parents to them. When you’re done with both of your parents, you draw a line between them and after that you put a pin where you were born and draw a line from your parents to you. In this way you will see how your parents and grandparents lives has changed from a different perspective, a better perspective in our opinion.