Statistics is part of all national curriculum and students share in this page their results obtained on statistics based on the Zoe car.
Pollution detectors collected some data on various parameters on the way from Bulgaria to France. These files are excell files: 2 files for 2 days in Tagosvishte BG, 1 file for Serbia and Croatia and 1 file for France.
So, let's dispatch roles now the following:
FR students are working on data from Serbia and Croatia, 
IT students are working on data from Targovishter BG,one or two days accoring to their choice,
BG students are working on data from France,
This collaboration could be finished by mid January 2017.
4 French students, Quentin, Yanis, Paul, Mathieu, explain their understanding in statistics about the indicators CO2 and O3 rates in Serbia and in Croatia in the video below. This task will be worked further in class. Please comment!
Second version.
Louis, Arthur, Yann and Matthis show another indicators.
Nathan, Fréderic, Victor and Pierre tell about air temperature.
On this page you can find the files related to the Pollution Detector Activity created during the students' meeting held in Italy in March 2017
BG students are working on data from France,
May 2017.
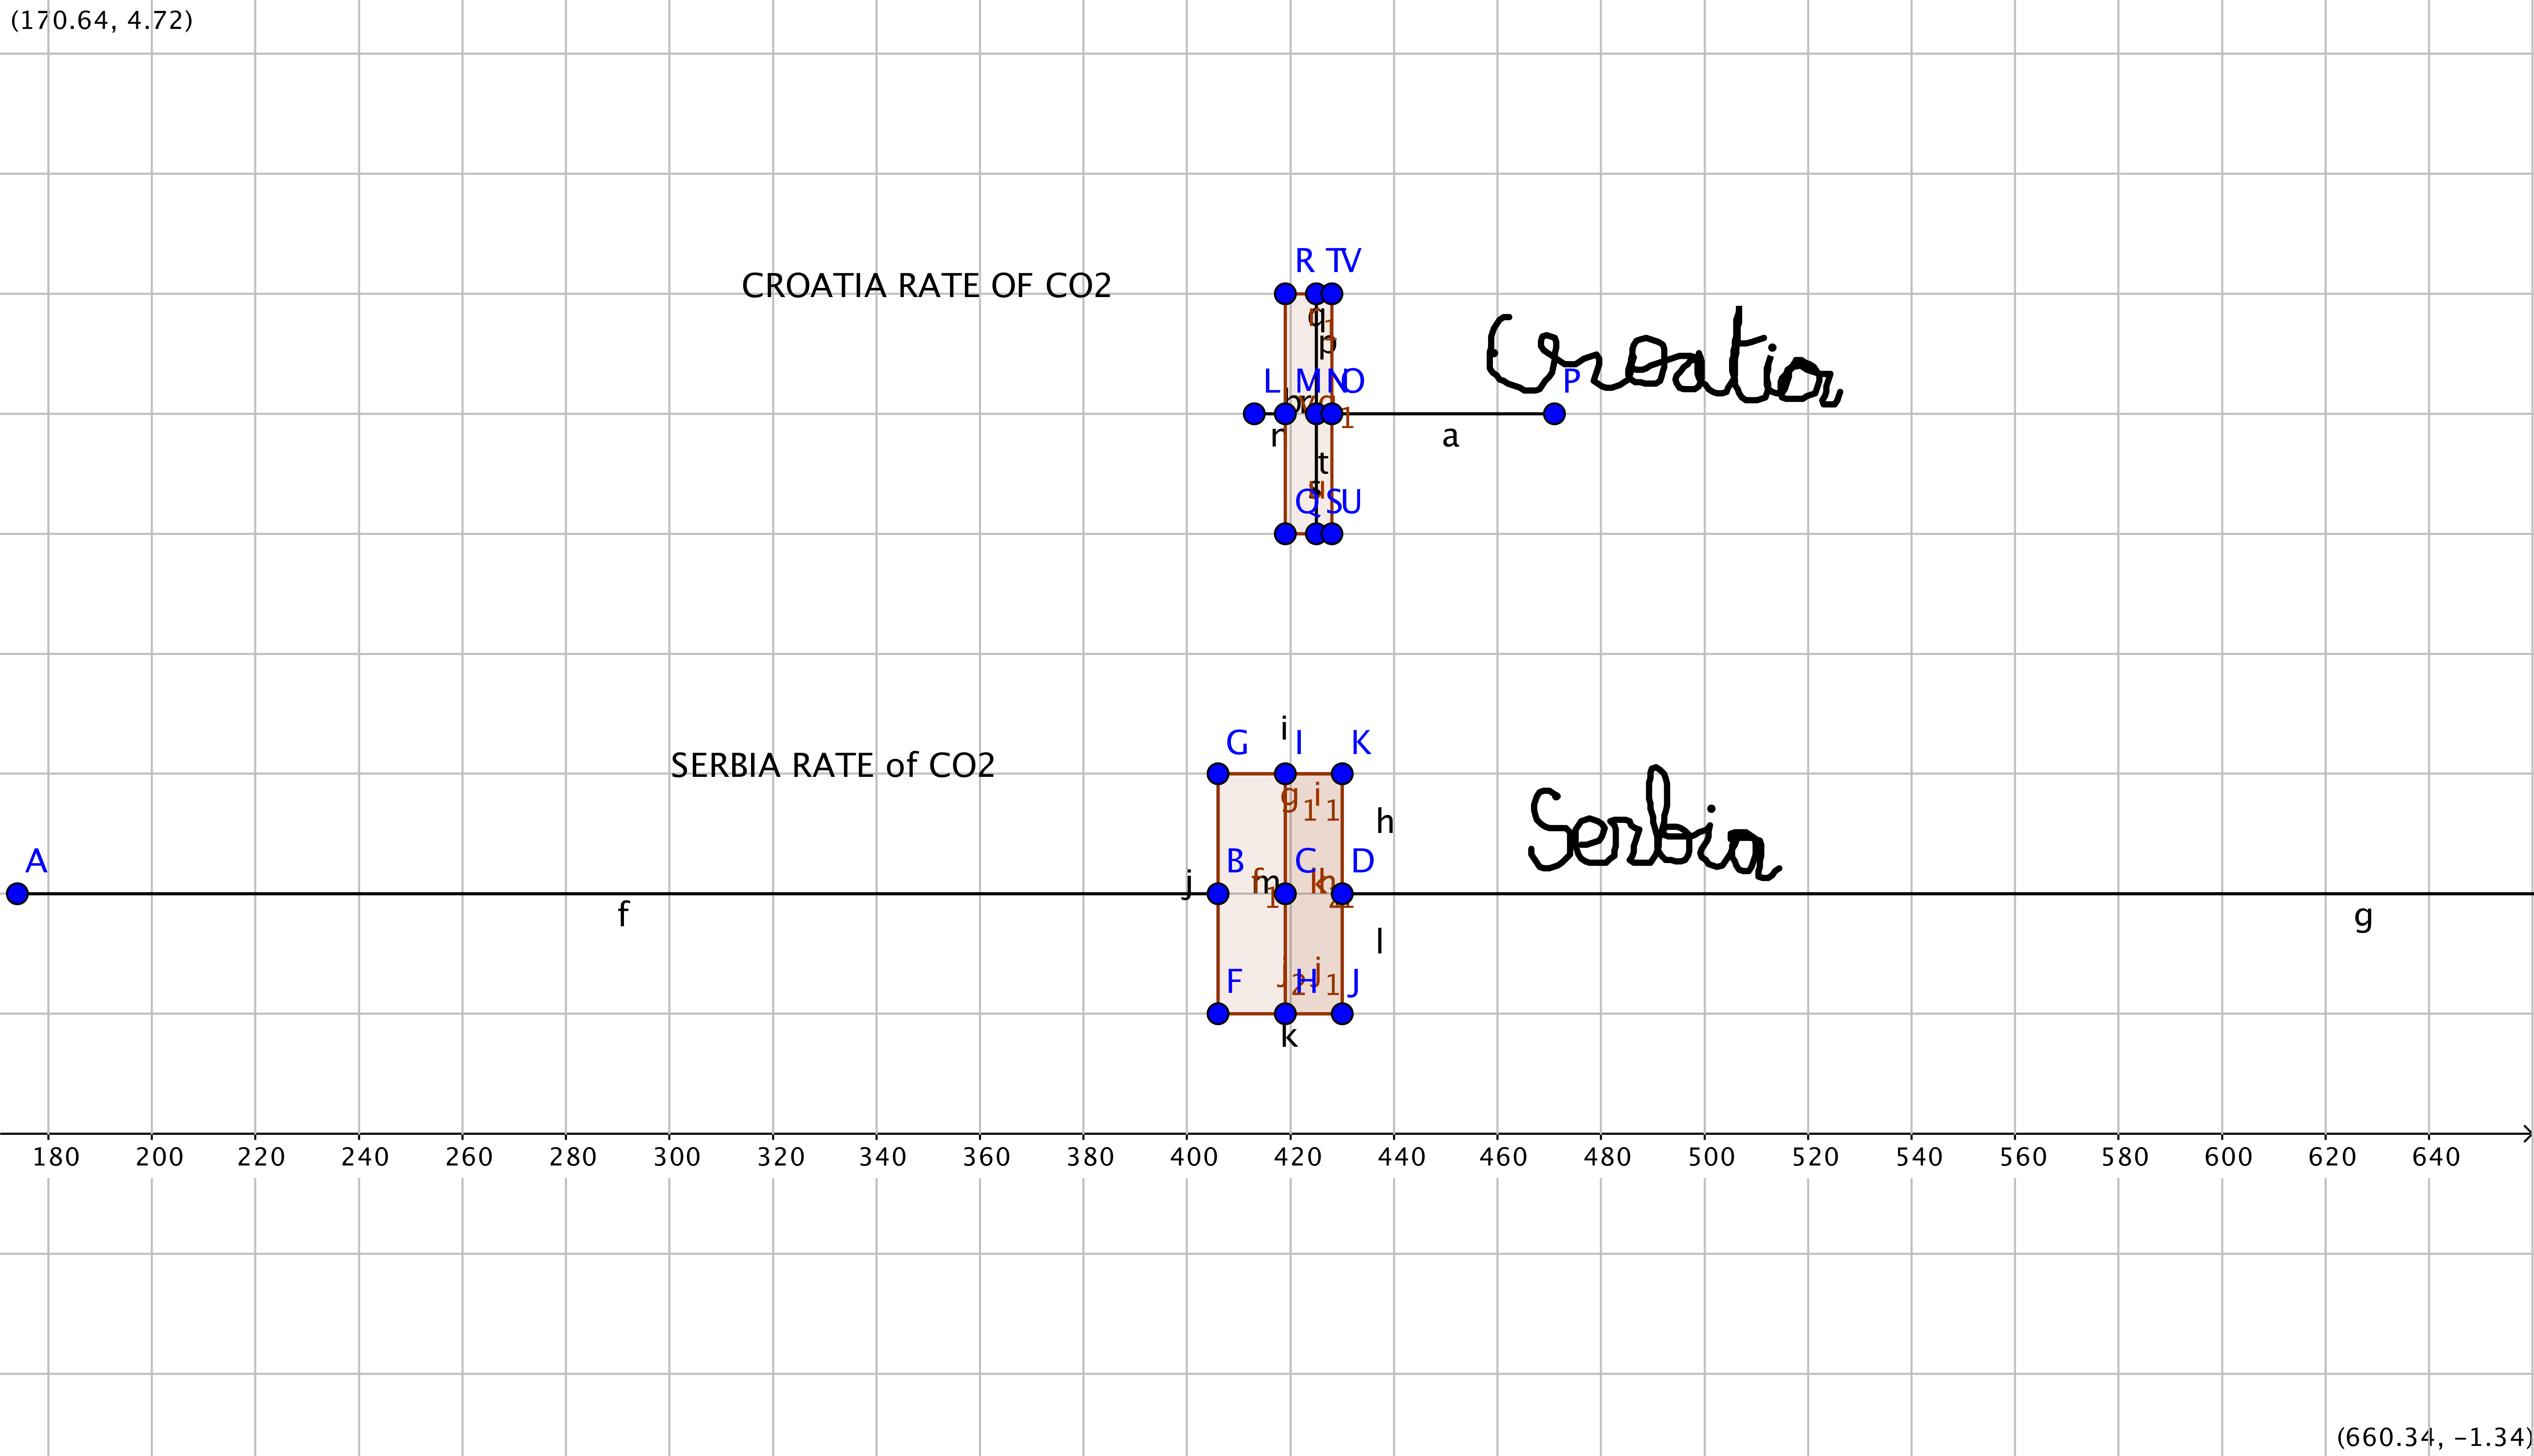
Yann Capitaine and Louis Havard from France display their results on the rate of CO2 measured in Serbia and Croatia. They draw a box plot diagram for each country one above the other to allow comparison, displaying minimum, first quartile, median, third quartile and maximum.
The original document using the geogebra software is not accepted by the twinspace and it has been sent per mail directly to the math teachers to allow their students to add on it their own box plot diagrams showing results from France and Bulgaria. Below is simply a picture to show their findings.
30 th May 2017.
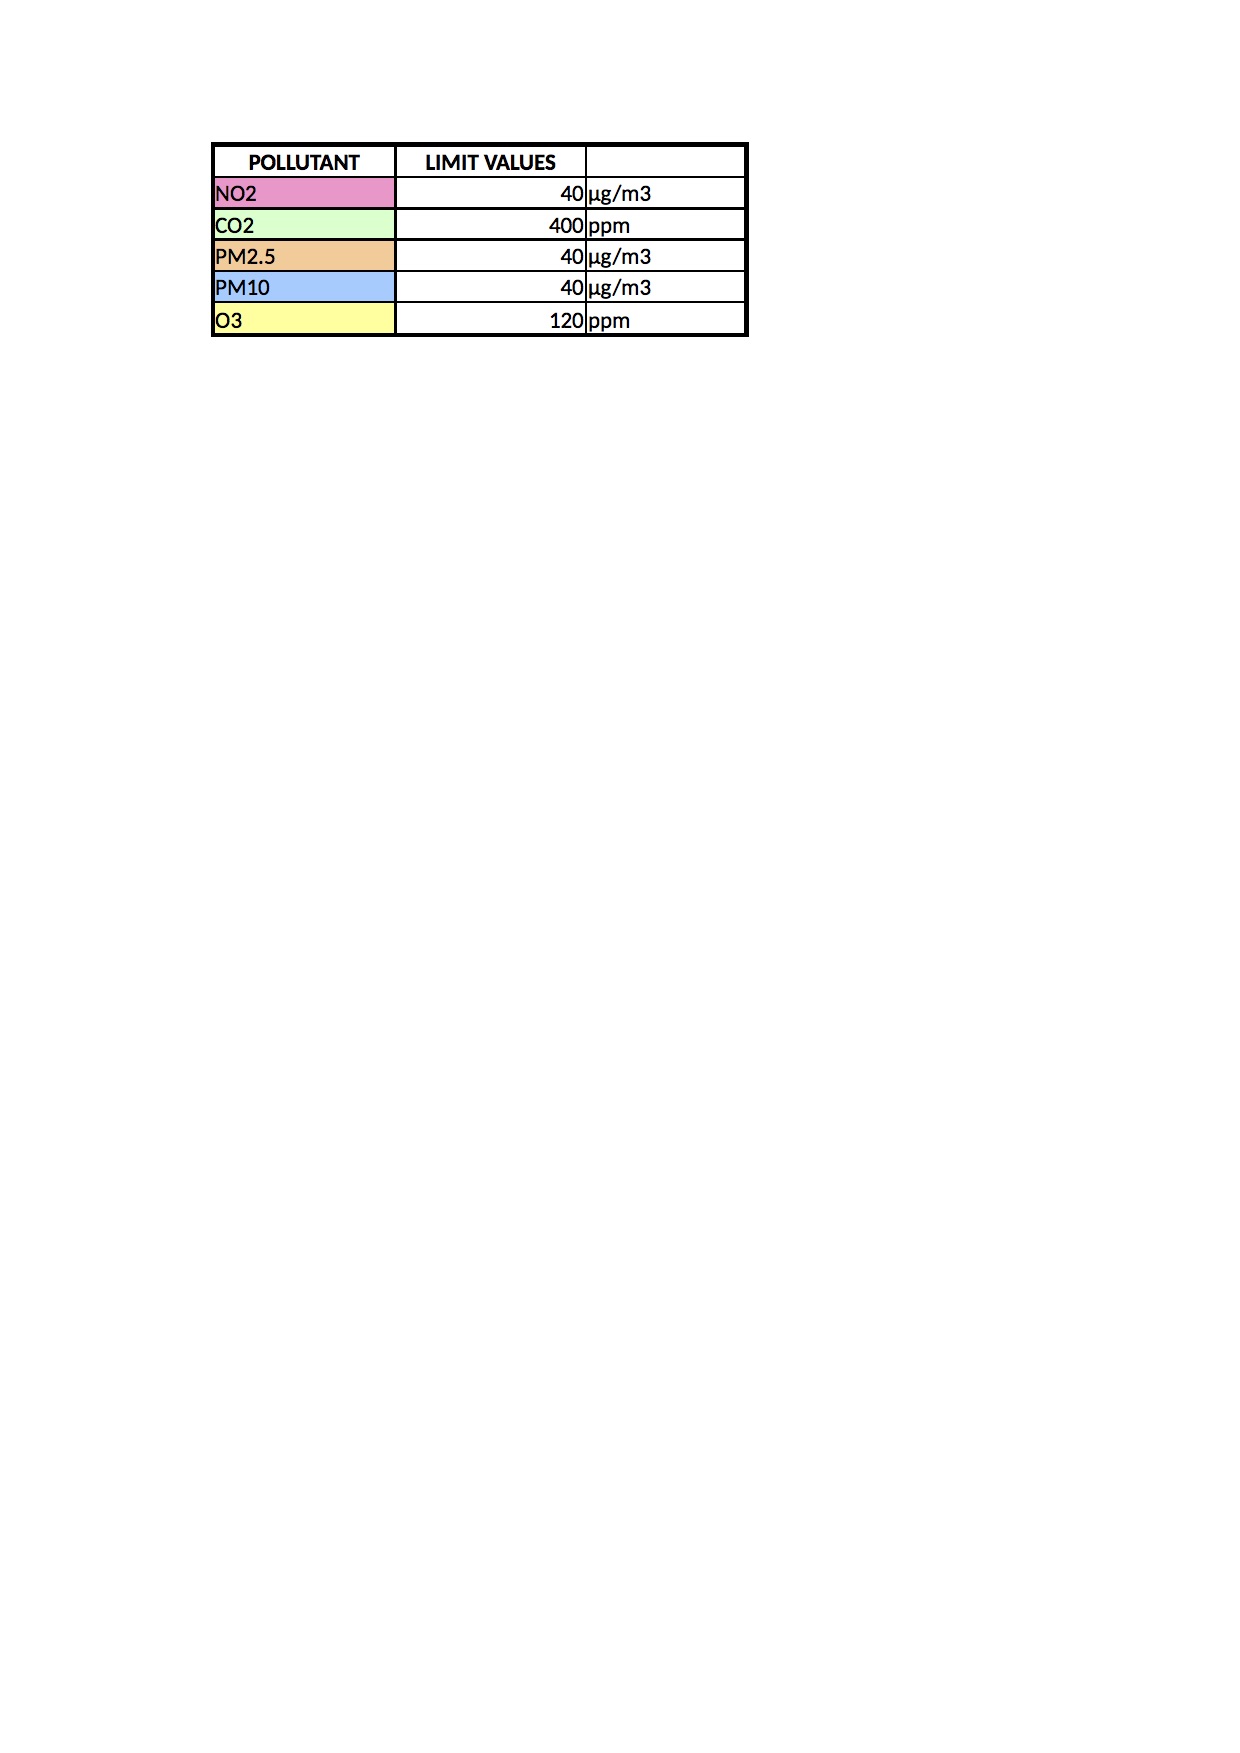
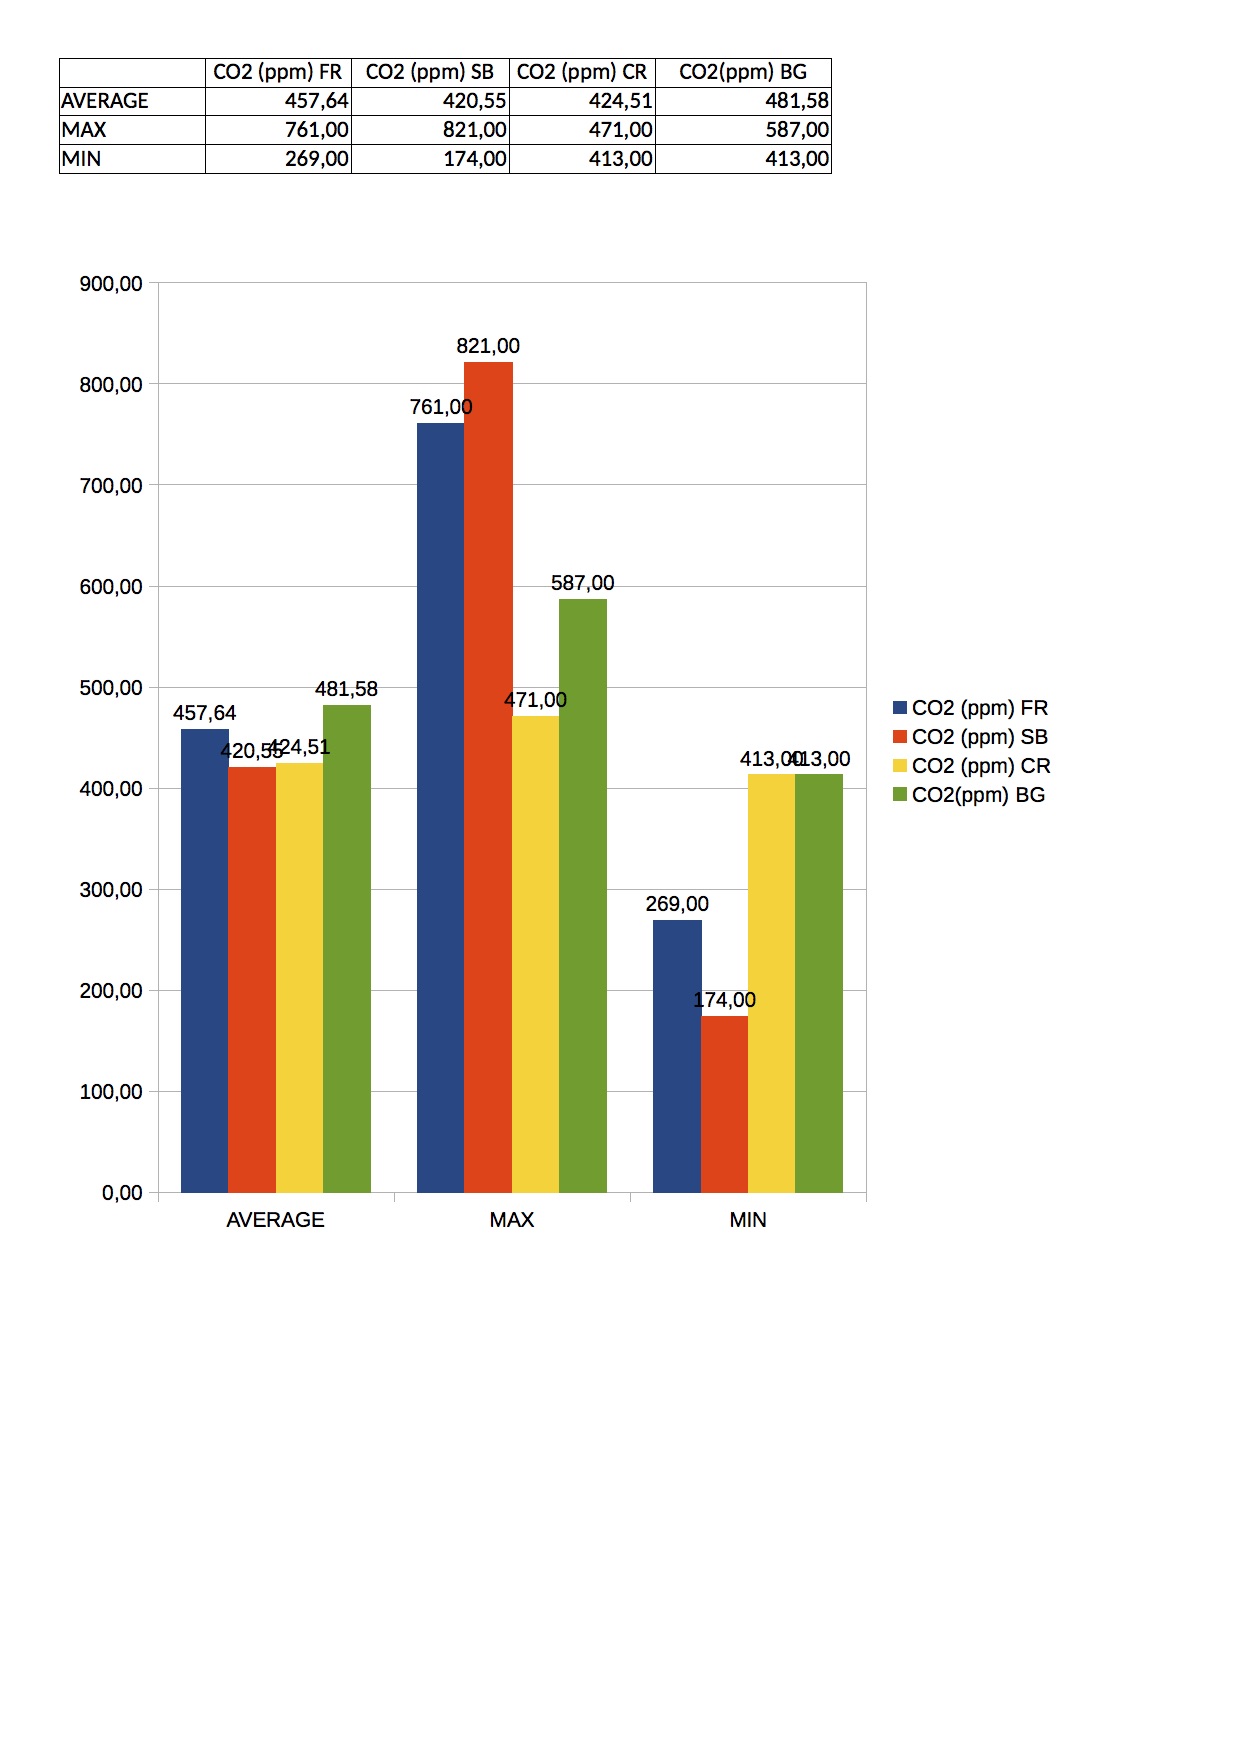
French students were given by French math teacher the diagrams showing statistics following the Bulgarian point of view: for each pollution indicator, the minimum, the mean and the maximum in the four countries Bulgaria, Serbia, Croatia, France. The French students commented on these diagrams based on the Italian team results giving the limits allowed for these indicators.
Guillin pierre and payen nathan
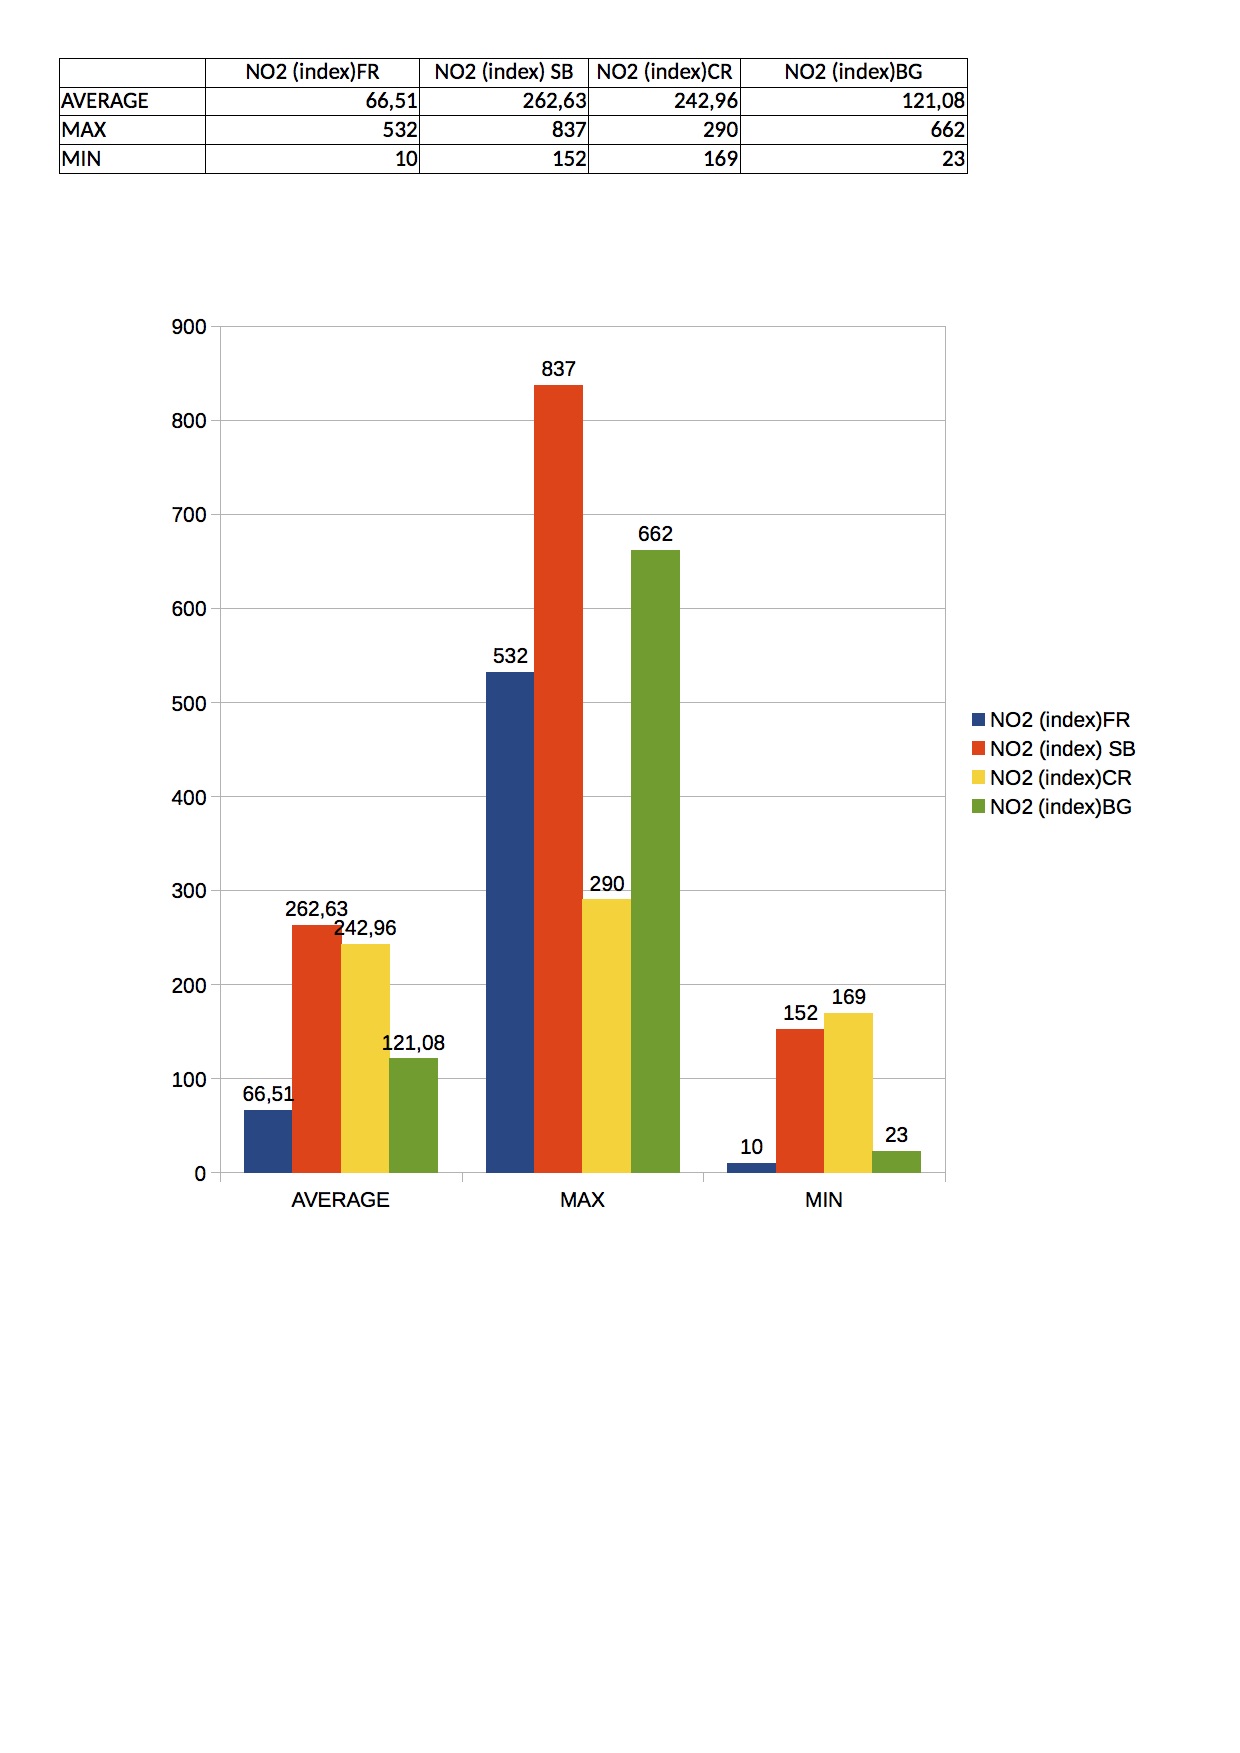
Serbia shows the NO2 maximum as higher than Bulgaria. Bulgaria shows the NO2 minimum as higher than France.
For the minimum the Croatia is higher than Serbia. the Bulgaria is higher than france.
The Serbia have the maximum average (262,63 micrograme). The france have the minimum average (66,51 micrograme).
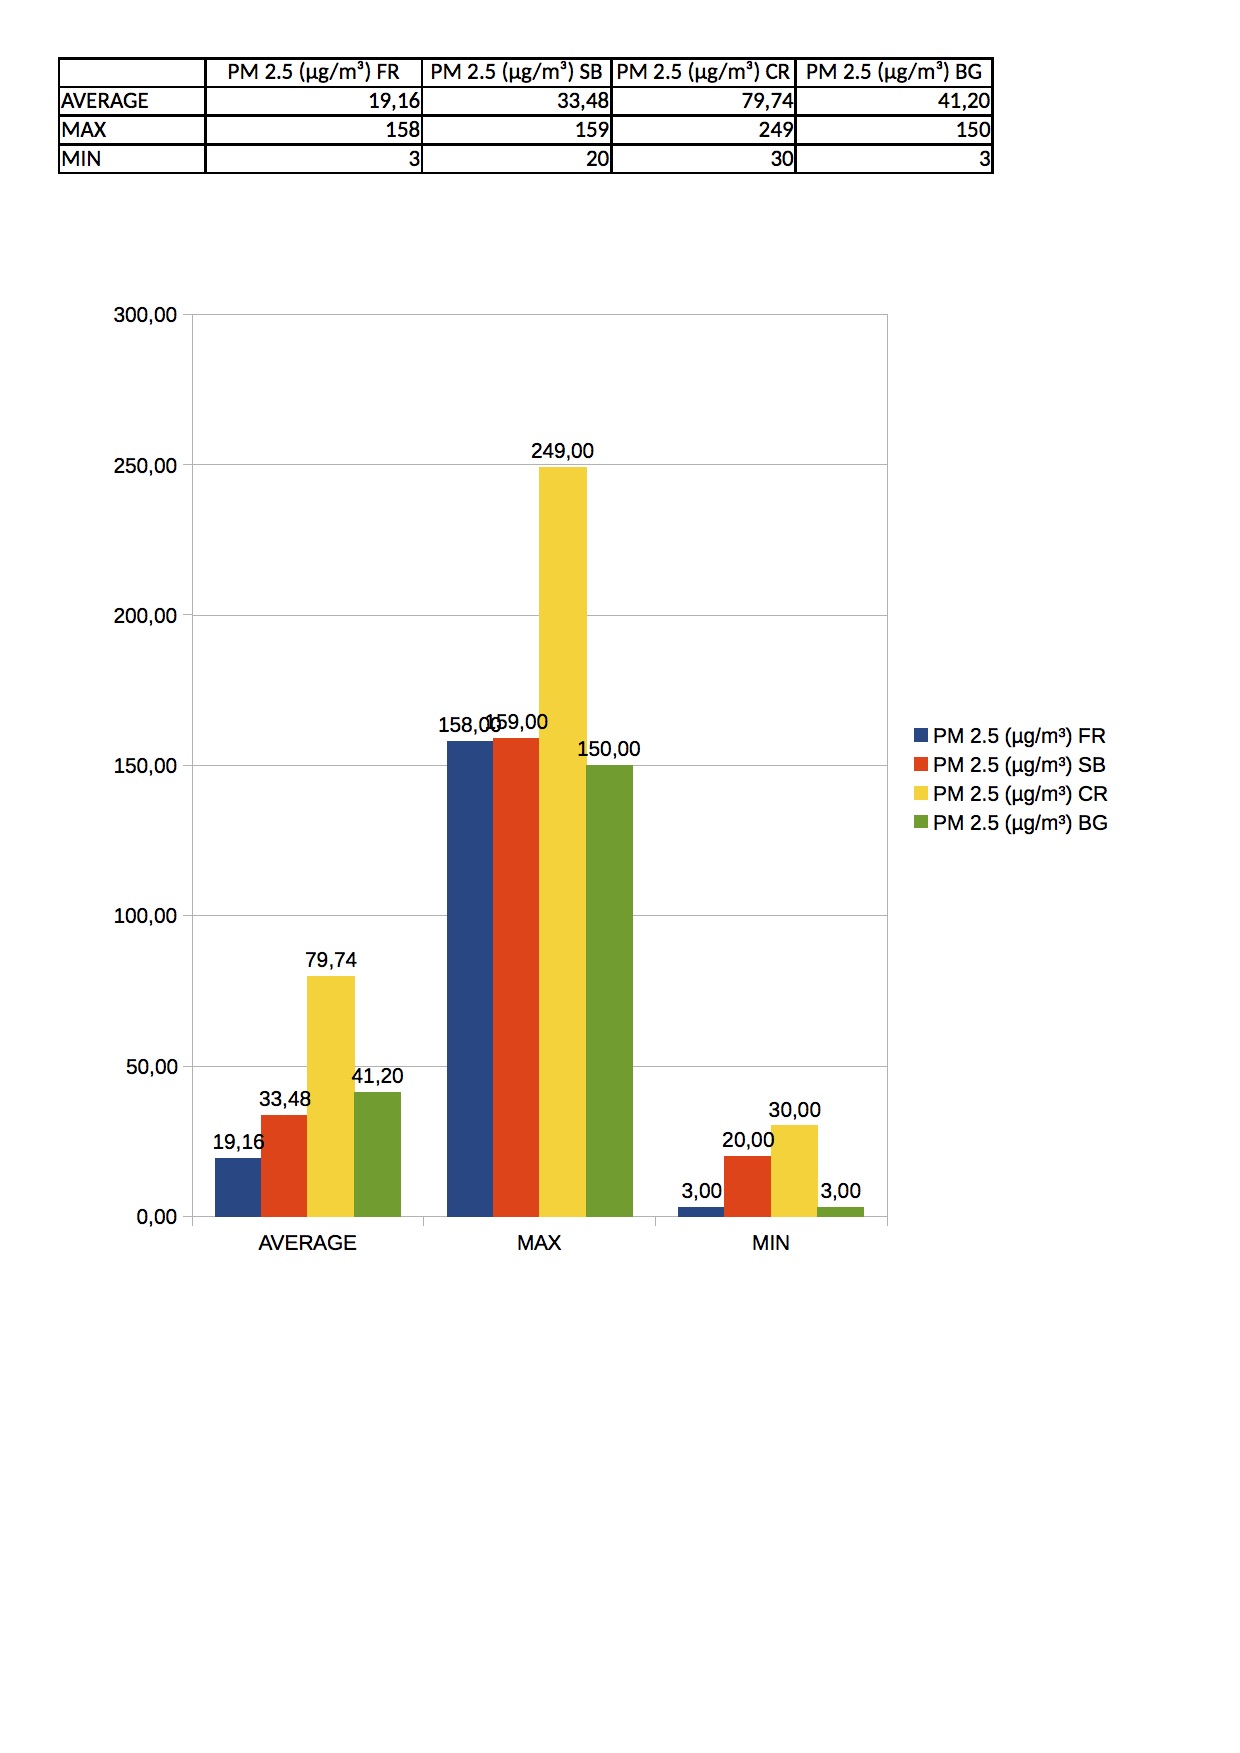
Arthur Dorlodot Frederic Renaud
Bleu : France :
-MAX :158.00
-Average : 19.16
-MIN : 3.00
Orange : Serbie :
-MAX : 159.00
-Average : 33.48
-MIN : 20.00
Jaune : Croatie :
-MAX : 249.00
-Average : 79.74
-MIN : 30.00
Vert : Bulgarie :
-MAX : 150.00
-Average : 41.20
- MIN :3.00
The Croatia have the highest average of the PM2,5 (79.74). Firstly in croatia have lot of particule matte approximativly twin of the norms and are the greatest of at all the category. On the contrary the loes is the France but we can see a big Max probably because have a big city product more particule matters 2.5
In all coyuntry except the croatia and france their are around the norms for the average For the max all are around 155μg/m³ And finaly for the min the France and Bulgarie are at 3μg/m³ and the Serbia and Croatia are aproximativly at 25μg/m³
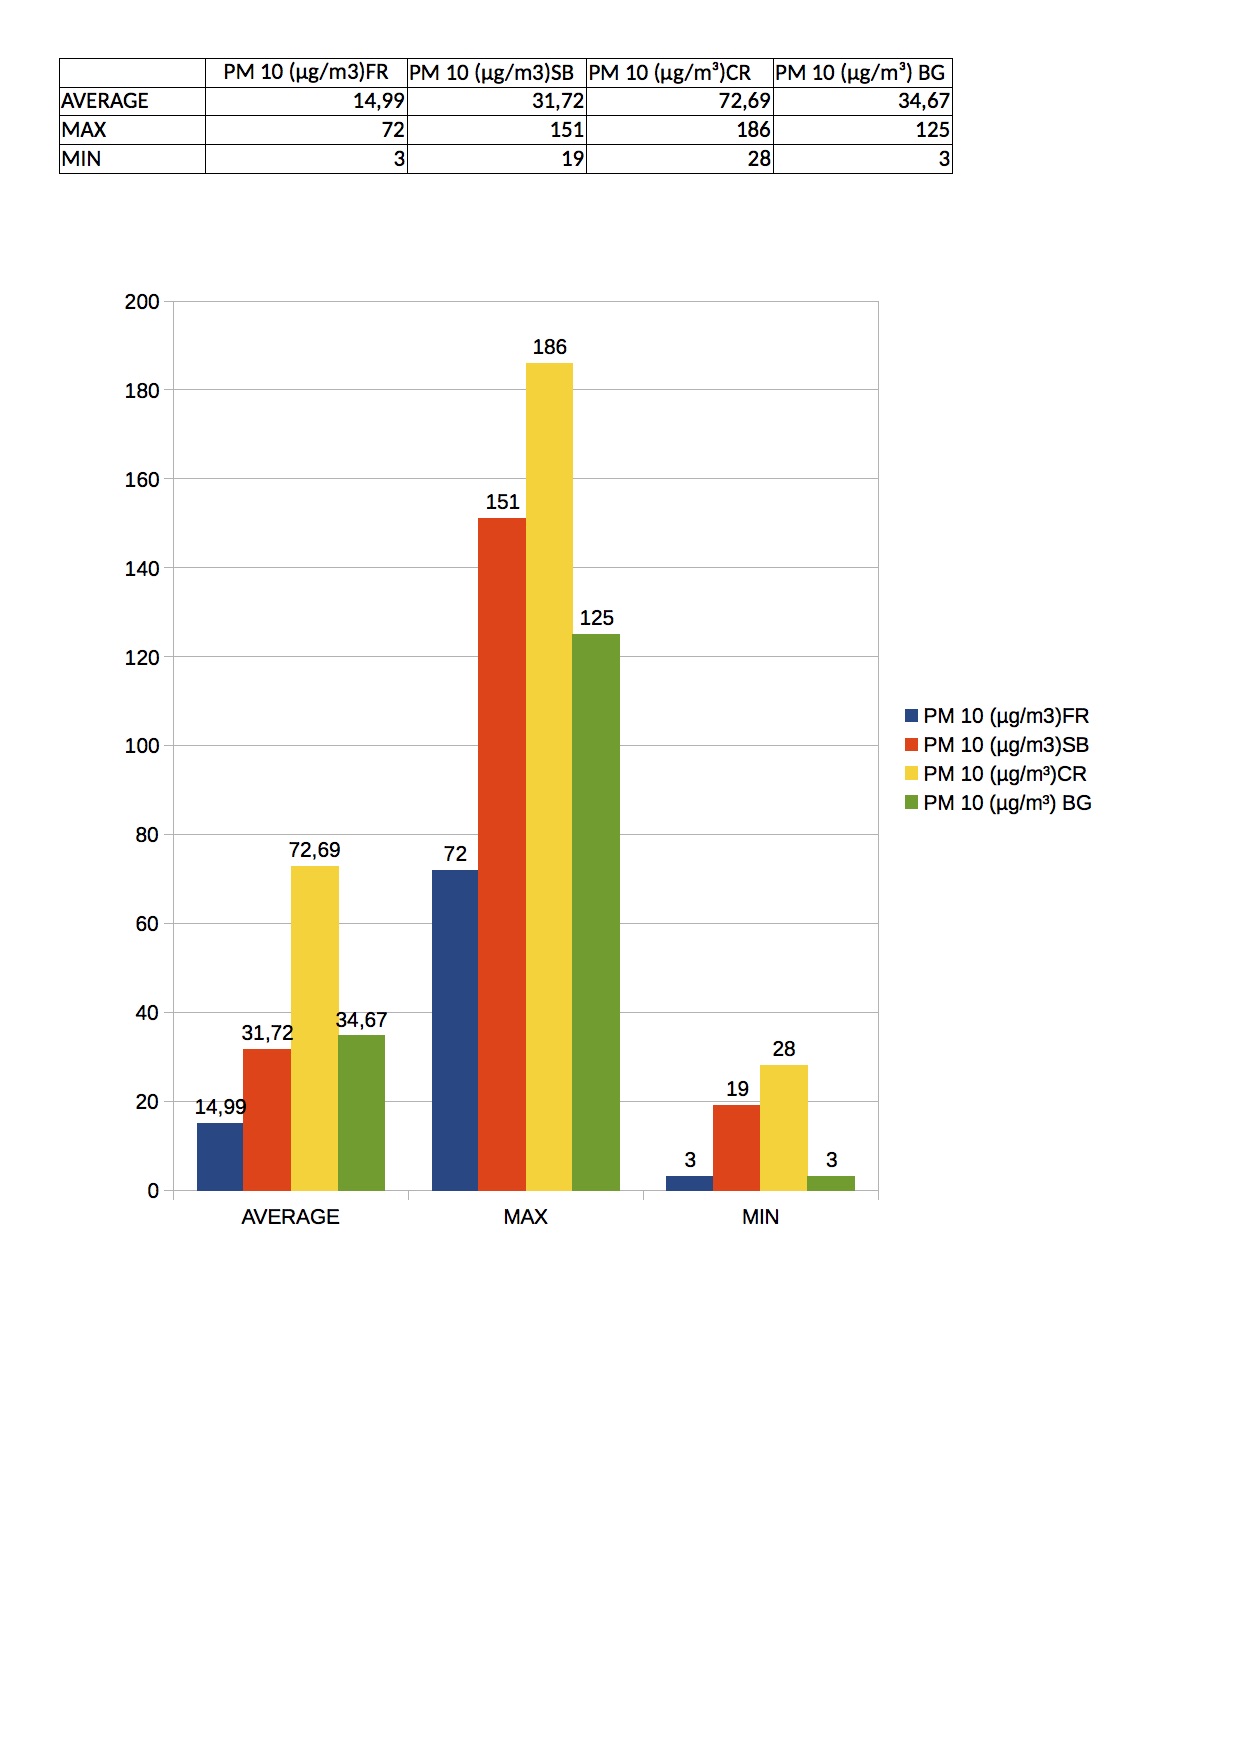
In the diagram for a PM 10 France is the country who consume the minimum for average with 14.99 µg/m3 and the max with 72 µg/m3 and the min with 3 µg/m3 and the min is equal to Bulgaria.
Croatia is the maximum of these four countries with the average : 72.69 µg/m3 ,max : 186 µg/m3 and the min :28 µg/m3.
Serbia is the second largest consumer with the average :31.72 µg/m3 but the Bulgaria is bigger than Serbia, max: 151 µg/m3, min: 19 µg/m3.
And the third is Bulgaria with 34.67 in average , 125 for max and 3 for minimum.