The chemistry italian students are preparing a lesson about the pollutants measured by detector. This is an example concerning one of them, the nitrogen dioxide.

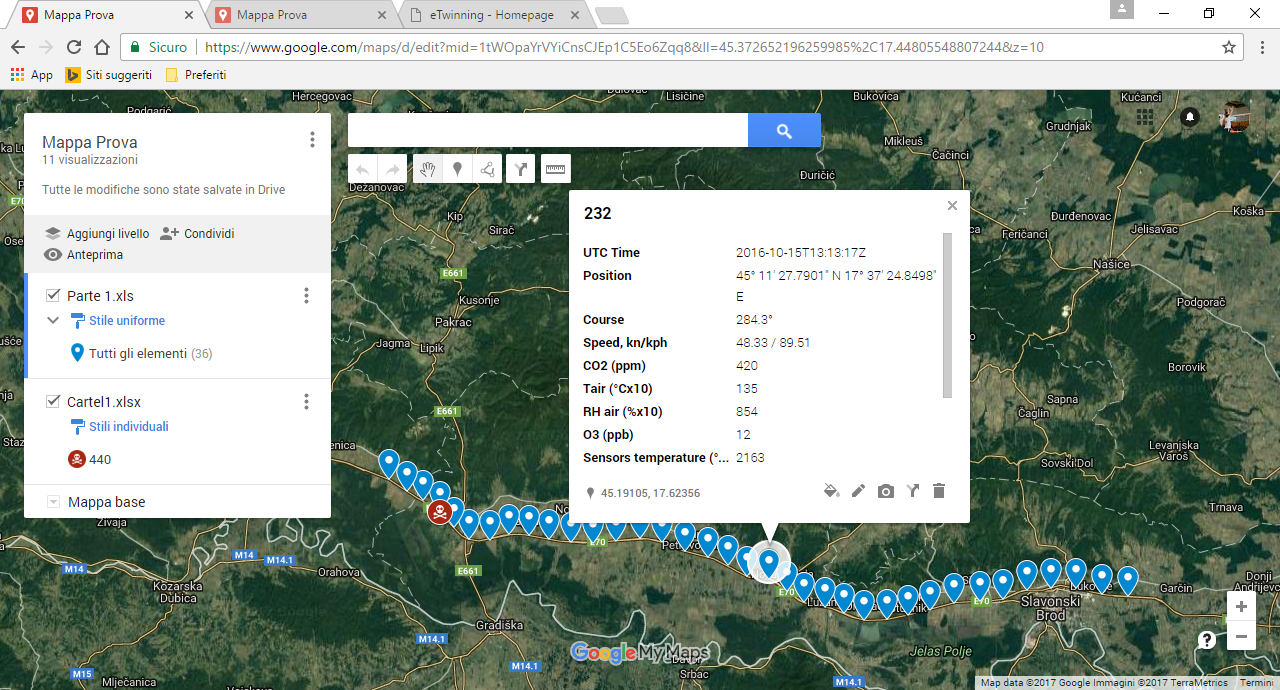
This is how Italian students worked on mapping data from the car detector. In the picture below you can see a draft sample using Google Maps. Clicking on an index point it will show a popup containing all desired information, such as CO2 or NO levels.
What do you think about?
On this page all informations for pollution detector activity.
Following the explaination to describe how can used the data :

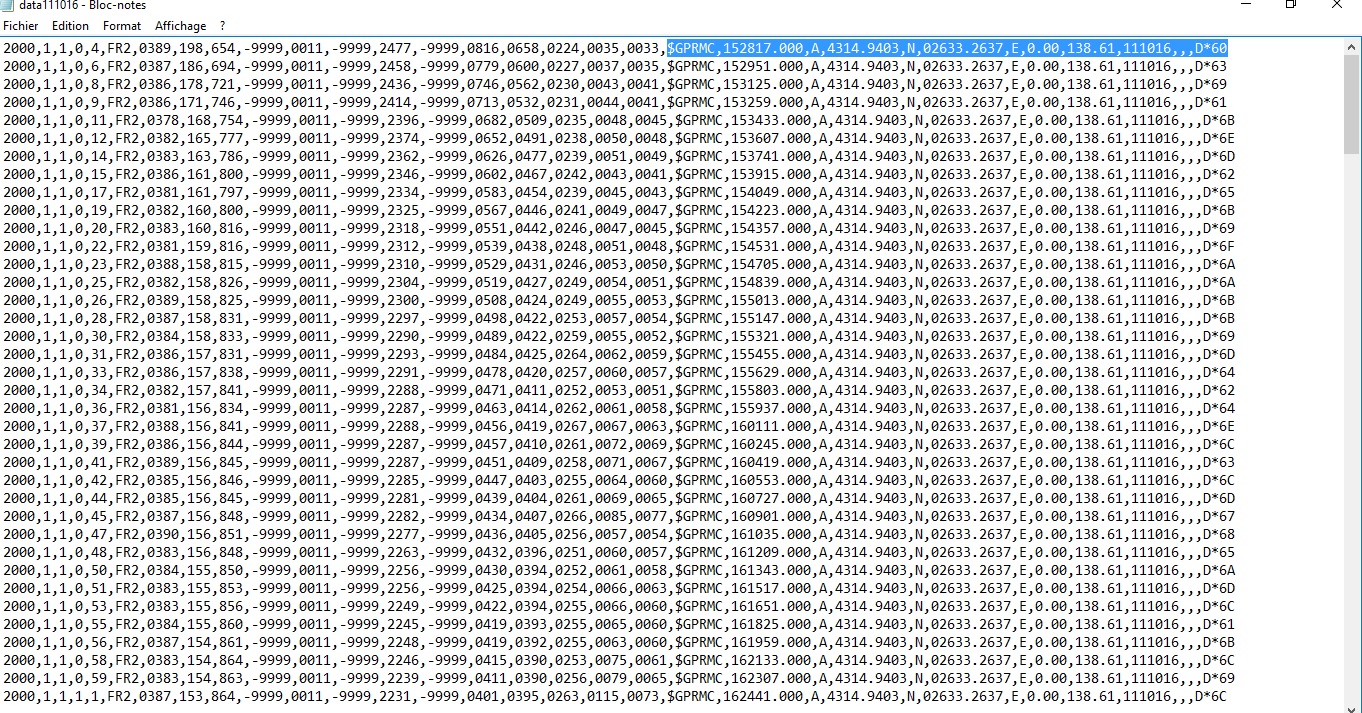
To obtien position from DATA base select the fils number like showing this after :
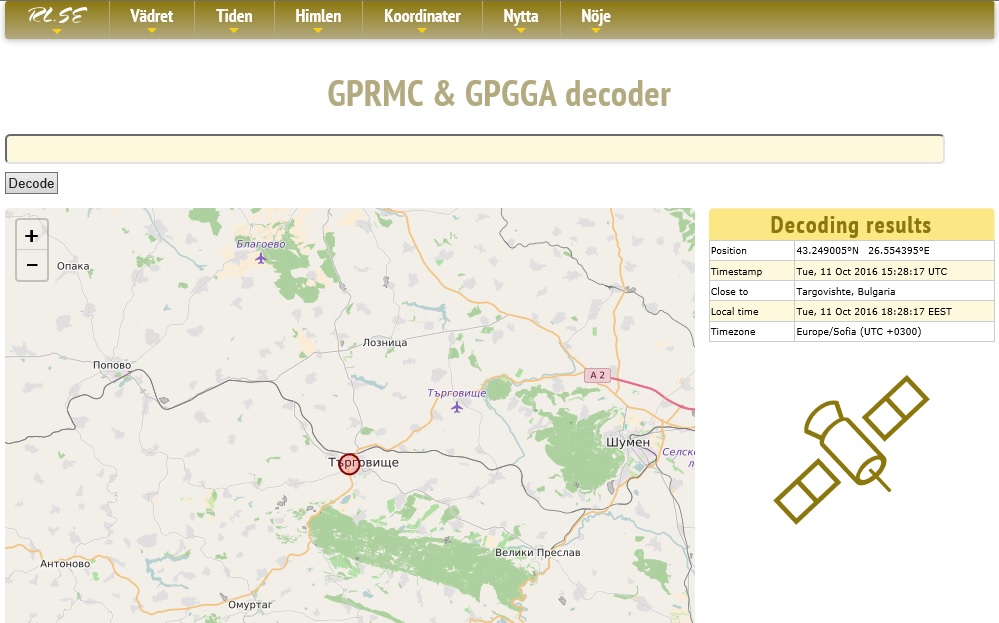
Copy and past on this website : https://rl.se/gprmc
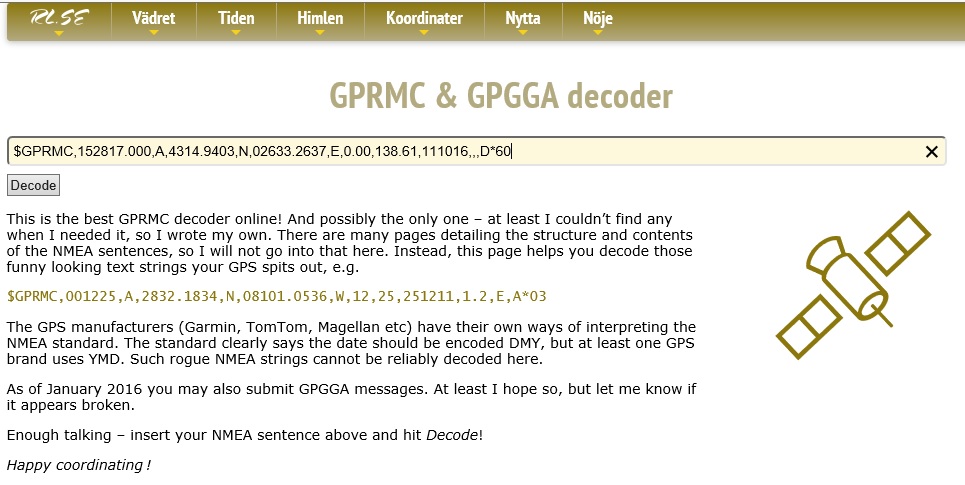
Decode :