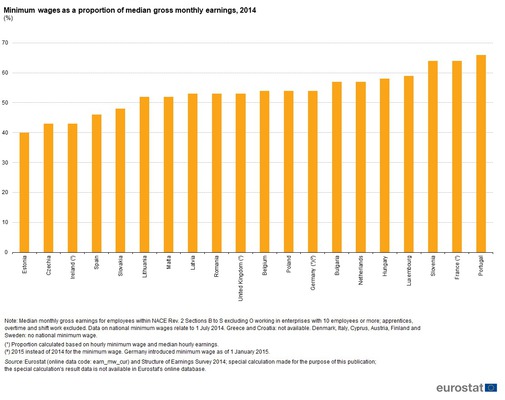
On average, a full-time employee in the EU works 40.2 hours per week in a usual working week. Men have a longer working week than women, working on average 41.0 hours compared with 39.3 hours for women.
Those in the mining and quarrying industry work the longest hours (42.0), while the shortest working week is to be found in the education sector (38.1).
Working week is longest in the UK, shortest in Denmark
On average, full-time employees in the UK spend the highest number of hours per week at their main job (42 hours). They are followed by those working in Cyprus (41.7), Austria (41.4), Greece (41.2), Poland and Portugal (both 41.1).
Denmark, with a working week of 37.8 hours, is the only country in which the normal number of working hours is less than 38. The next shortest week is in Italy (38.8), followed by the Netherlands and France (both 39.0), Finland and Ireland (39.1).
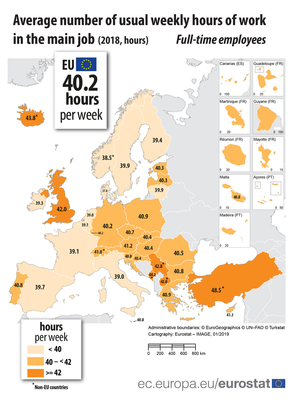
Minimum wages expressed in purchasing power standards
The gap between countries in the level of minimum wages was considerably smaller once price level differences were taken into account
Figure 2 compares gross minimum wages taking into account differences in price levels by applying purchasing power parities (PPPs) for household final consumption expenditure; as might be expected, adjusting for differences in price levels reduces the variation between countries. Based on the level of their national gross monthly minimum wages expressed in PPS terms, the EU Member States covered by this data collection may be classified into three different groups; again, non-member countries are shown as a separate group in Figure 2.
- Group 1, where national minimum wages were lower than PPS 800 in July 2019. The EU Member States in this group included: Bulgaria, Latvia, Estonia, Czechia, Slovakia, Croatia and Hungary; their national minimum wages ranged from PPS 566 in Bulgaria to PPS 748 in Hungary.
- Group 2, where national minimum wages were at least PPS 800 but lower than PPS 1 000 in July 2019. There were six EU Member States in this group, namely: Portugal, Lithuania, Romania, Greece, Poland and Malta; their national minimum wages ranged from PPS 807 in Portugal to PPS 927 in Malta.
- Group 3, where national minimum wages were at least PPS 1 000 in July 2019. The EU Member States in this group included: Slovenia, Spain, Ireland, the United Kingdom, France, Belgium, the Netherlands, Germany and Luxembourg; their national minimum wages ranged from PPS 1 044 in Slovenia to PPS 1 636 in Luxembourg.
- With the exception of Turkey, the four remaining EU candidate countries had minimum wages expressed in PPS that were similar to those in group 1, ranging from PPS 383 in Albania to PPS 591 in Montenegro. Turkey (with a national minimum wage of PPS 1 033) had minimum wages expressed in PPS that were in the range of the group 3 while the United States (PPS 982) had minimum wage expressed in PPS that was in the range of the group 2.
The EU Member States in Group 1, with relatively low minimum wages in euro terms, tended to have lower price levels and therefore relatively higher minimum wages when expressed in purchasing power standard (PPS). On the other hand, Member States in Group 3, with relatively high minimum wages in euro terms, tended to have higher price levels and their minimum wages in PPS terms were therefore often lower. This adjustment for price levels has the effect of partly smoothing the distinct breaks between the three different groups of Member States that were identified when minimum wages were ranked in euro terms.
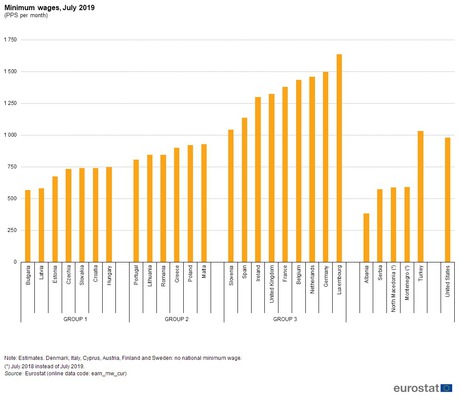
Minimum wage levels in relation to median gross earnings
Figure 3 provides information in relation to the share of the national minimum wage in median gross earnings.
National minimum wages expressed in euro terms were taken as of 1 July 2014 and divided by the median gross earnings measured from the Structure of Earnings Survey (SES 2014). In July 2014, the proportion of minimum wages in median earnings across the EU Member States varied from 40 % to 66 %. For the purpose of this analysis, payments for overtime and shift work have been excluded from the calculation of median gross monthly earnings. In the case of Germany, France, Ireland and the United Kingdom, whose minimum wages are set on an hourly basis, the ratio was calculated as a proportion of the median hourly earnings. For the other 16 EU Member states, that have national monthly minimum wages and for which data is available, the ratio was calculated as a proportion of the median monthly earnings.