The international collaboration path of the eTwinning project consists of several tasks that we had to carry out.
This is the final infographic we prepared collaboratively using Canva to sum up our job.
Task 1
In our society where Science and Mathematics are of great importance.
A mathematical model can help calculate future situations and enable people to understand how to behave. In fact, during the COVID-19 pandemic, many mathematical models of prevention considering the infection's growth rate were created to make predictions about the course of infection; it is thanks to this rate that European governments set guidelines for flattening the curve.
Through Mathematics we can examine the infection data using the formula:
N (people infected) / t (time period) = percentage increase in daily cases.
This rate of increase in infections, if not controlled, grows followin an exponential function curve that must be flattened. The curve tends to peak, so the trend is exponential (more people infected). The curve does not remain constant and sooner or later it will drop. Thanks to this deduction it is possible to create a logistic function summarised by the formula: a (1-N / Nmax)^N where Nmax is the maximum number of people who can be infected. The number N of people initially infected is low, but following an exponential logic this number grows every day and multiplies, only through restriction measures can we lower this number. The rate of infection is able to change the course of the infection curve, and by plotting the rate of new infections over time of the number of infected, we can see the flattening of the curve.
When the growth rate is higher, the number of sick people increases at the same time.
We can therefore deduce that mathematics also plays a fundamental role in everyday life in solving very serious and important situations.
Task 2
As a second task we dedicated ourselves to making a summary of an article concerning the COVID infection curve. In our situation it’s very important to know the main summary of the words that we listen to everyday.
We studied the mathematical models:
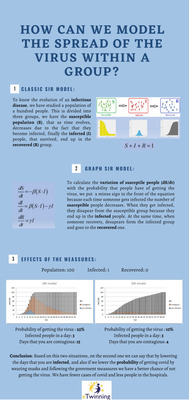
Classic SIR model:
To know the evolution of an infectious disease, we have studied a population of a hundred people. This is divided into three groups, we have the susceptible population (S), that as time evolves, decreases due to the fact that they become infected, finally the infected (I) people, that survived, end up in the recovered (R) group.
Grahpical SIR model:
To calculate the variation of susceptible people (dS/dt) with the probability that people have of getting the virus, we put a minus sign in the front of the equation because each time someone gets infected the number of susceptible people decreases. When they get infected, they disappear from the susceptible group because they end up in the infected people. At the same time, when someone recovers, disappears from the infected group and goes to the recovered one.
Task 3
To carry out task 3 we used a table with different values regarding the number of infected, healed and COVID deaths. We played with these values, noticing how increasing or decreasing a certain value, the others varied. Through these types of tables you can get a more detailed idea of the numbers with which we are faced in this situation is how important are the graphs that allow us to show the trend of infections. This shows the importance of mathematics, present in any situation is ready to give man a more realistic perception of the situation , giving us data at the base of the course of the pandemic