Students create national groups (one for each country). You can use this app to create groups
http://www.transum.org/software/RandomStudents/
Each national team:
1) This group for 2 weeks will count the water consumption at home (by the house meter) once a week.
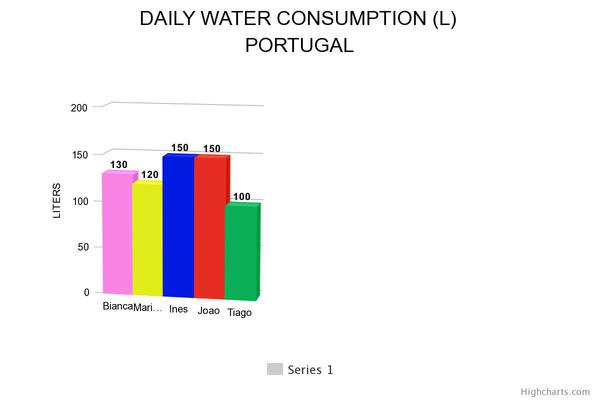
2) They will calculate the average daily water consumption per person in each home in litres ( mc 1= 1000 lt)
3) They will calculate the average per person in each national group
4) They will create a graph about water consumption per person per day in 5 European countries (mm3 - cubic meters - per day per person).
5) They will insert the data in:
https://www.meta-chart.com/histogram
Here is a tutorial that will help you for the online histogram
tutorial histogram.pdf
There will be a folder (Water Histograms) in materials, where you can put your histogram. You can call this: Histogram - The name of the country.
The deadline of this work will be on 20th of April 2019.
THE RESULTS: COMPARING COUNTRIES
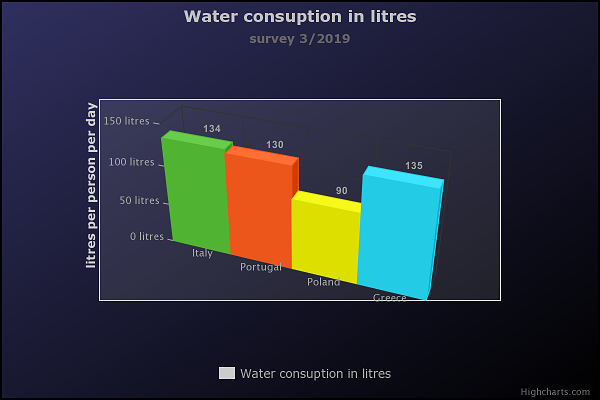
Results:
water histogram Italy 1D.pdf
Water histogram Greece.pdf
water histogram.pdf class 1°D italy