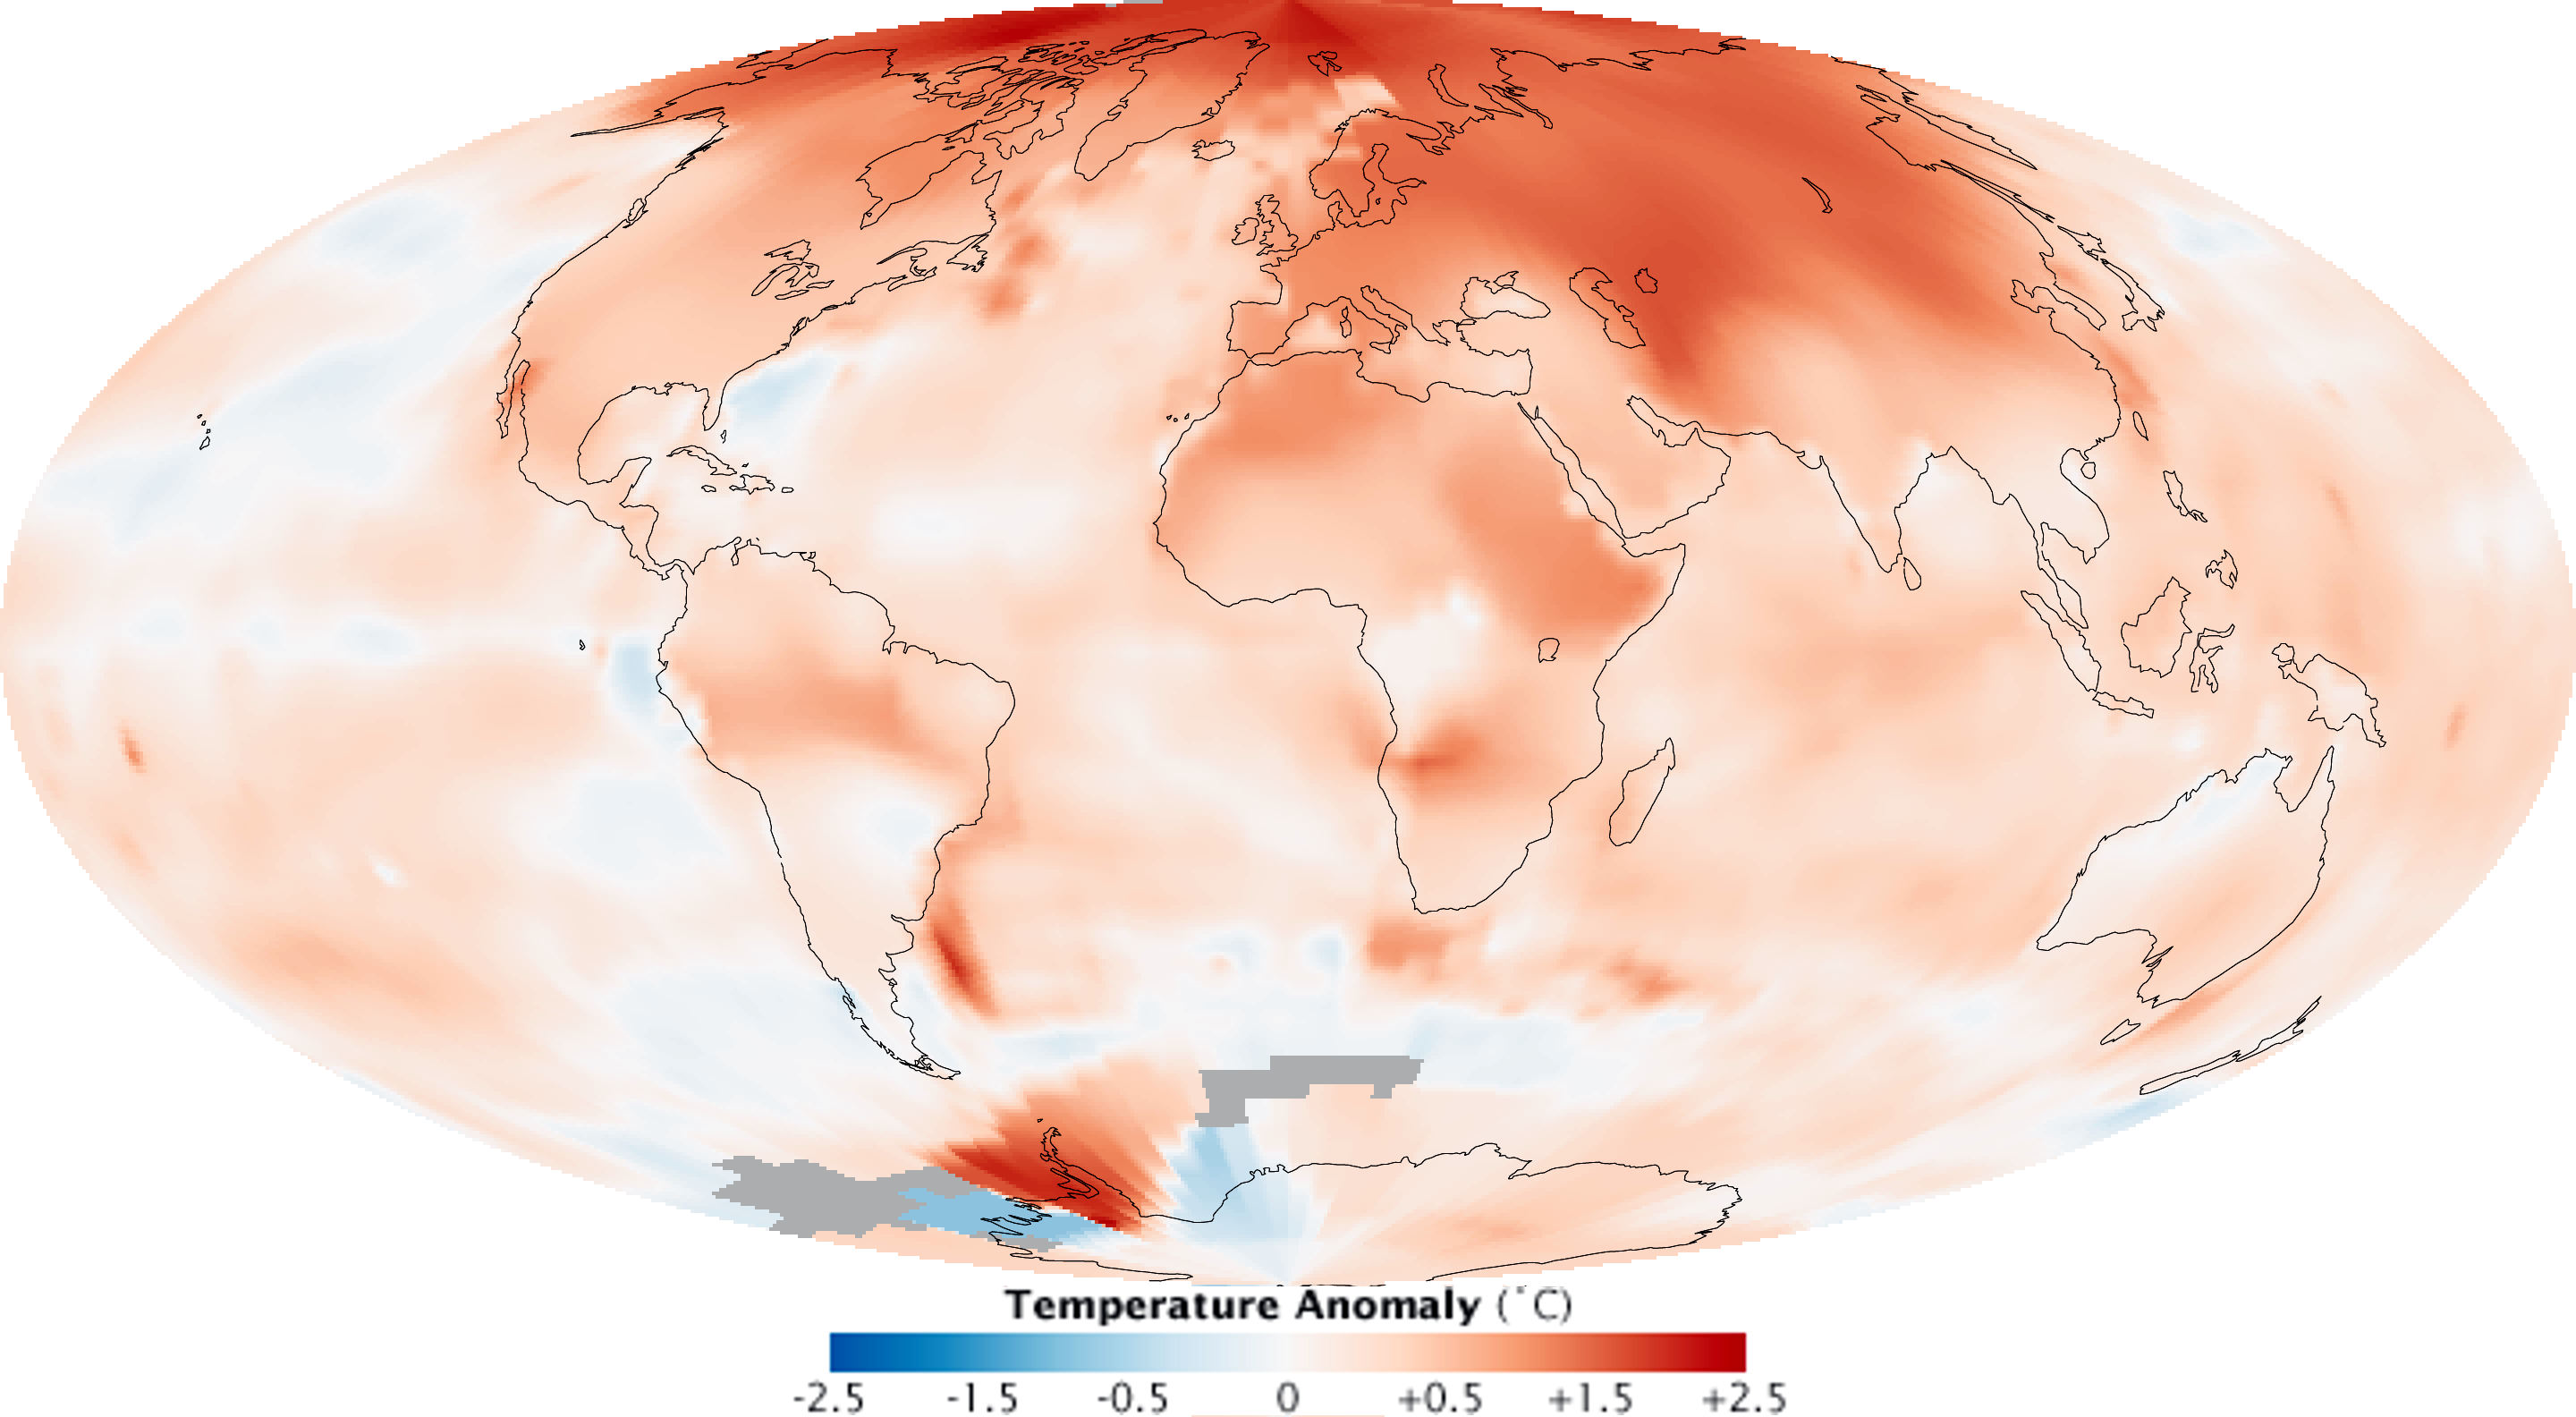
In the last two years we studied Climate Change and its effects.
Is the temperature rising in our areas? Let us check it!
In the following file we are collecting data about the average temperatures of our countries.
If you are one of the students working on this project, please, open this file and click on the sheet related to your country. Then, please, add data of the yearly average temperature of your country from 1987 to 2017 according to the following scheme:
| Year | Average temperature (°C) - Your Town - Your Country |
| 1987 | ... |
| 1988 | ... |
| ... | ... |
| 2017 | ... |
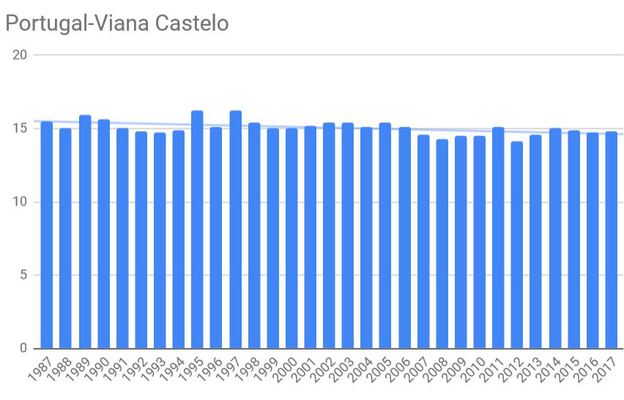
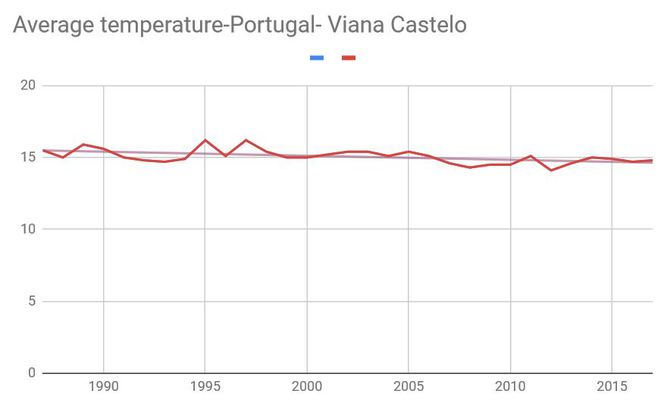
Afterward, please, create a graph using your data and add a trend line.
At last you can create a picture of your graph and add it here. You can also import your graph, following this procedure:
- In Google open the file.
- At the top, click File
 Publish to the web.
 - In the window that appears, click Embed.
- Choose your graph to publish
- Click Publish.
- Copy the code in the text box and paste it here
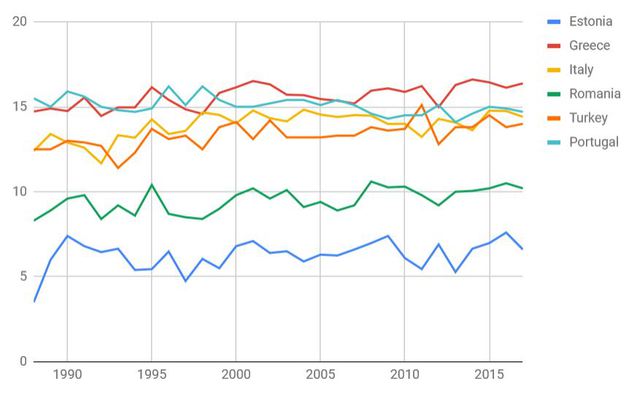
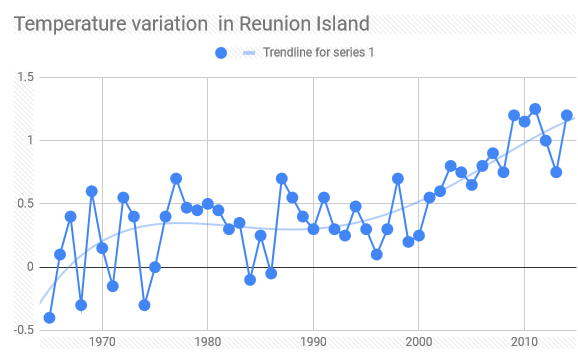
We can, then, compare the data and find the evolution of the temperature in Europe.
Here you can find an example of the graph to ease your work.
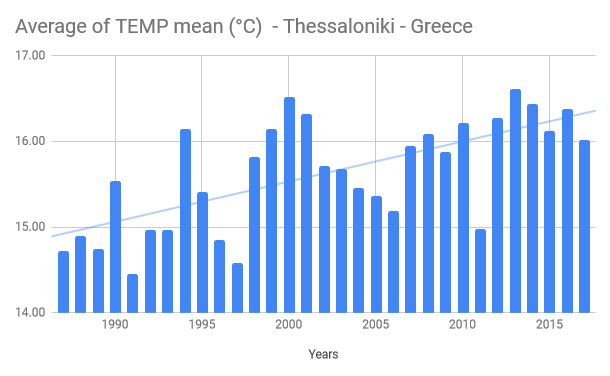
Data from Macedonia Airport

====================================================================
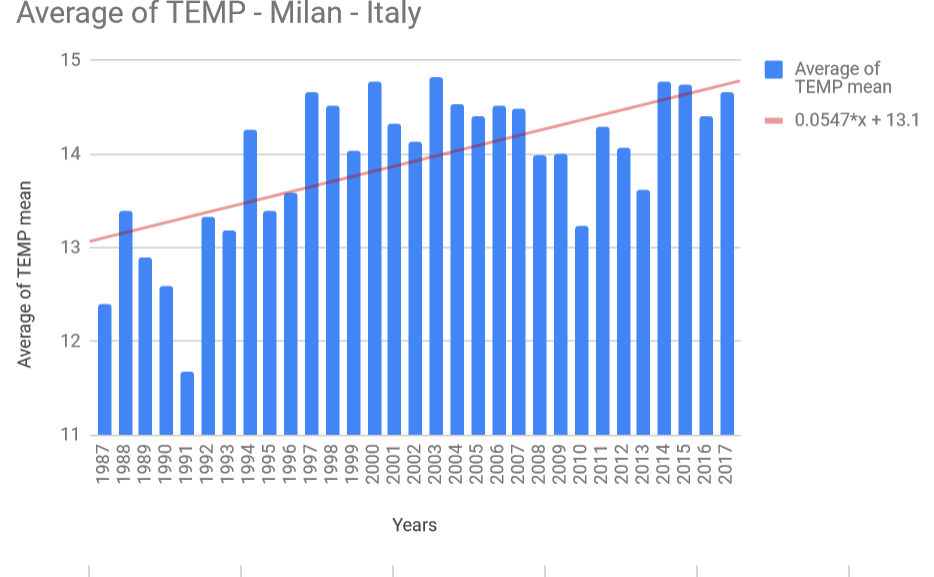
Data from Milano Linate Airport

====================================================================
====================================================================


===================================================================
===================================================================