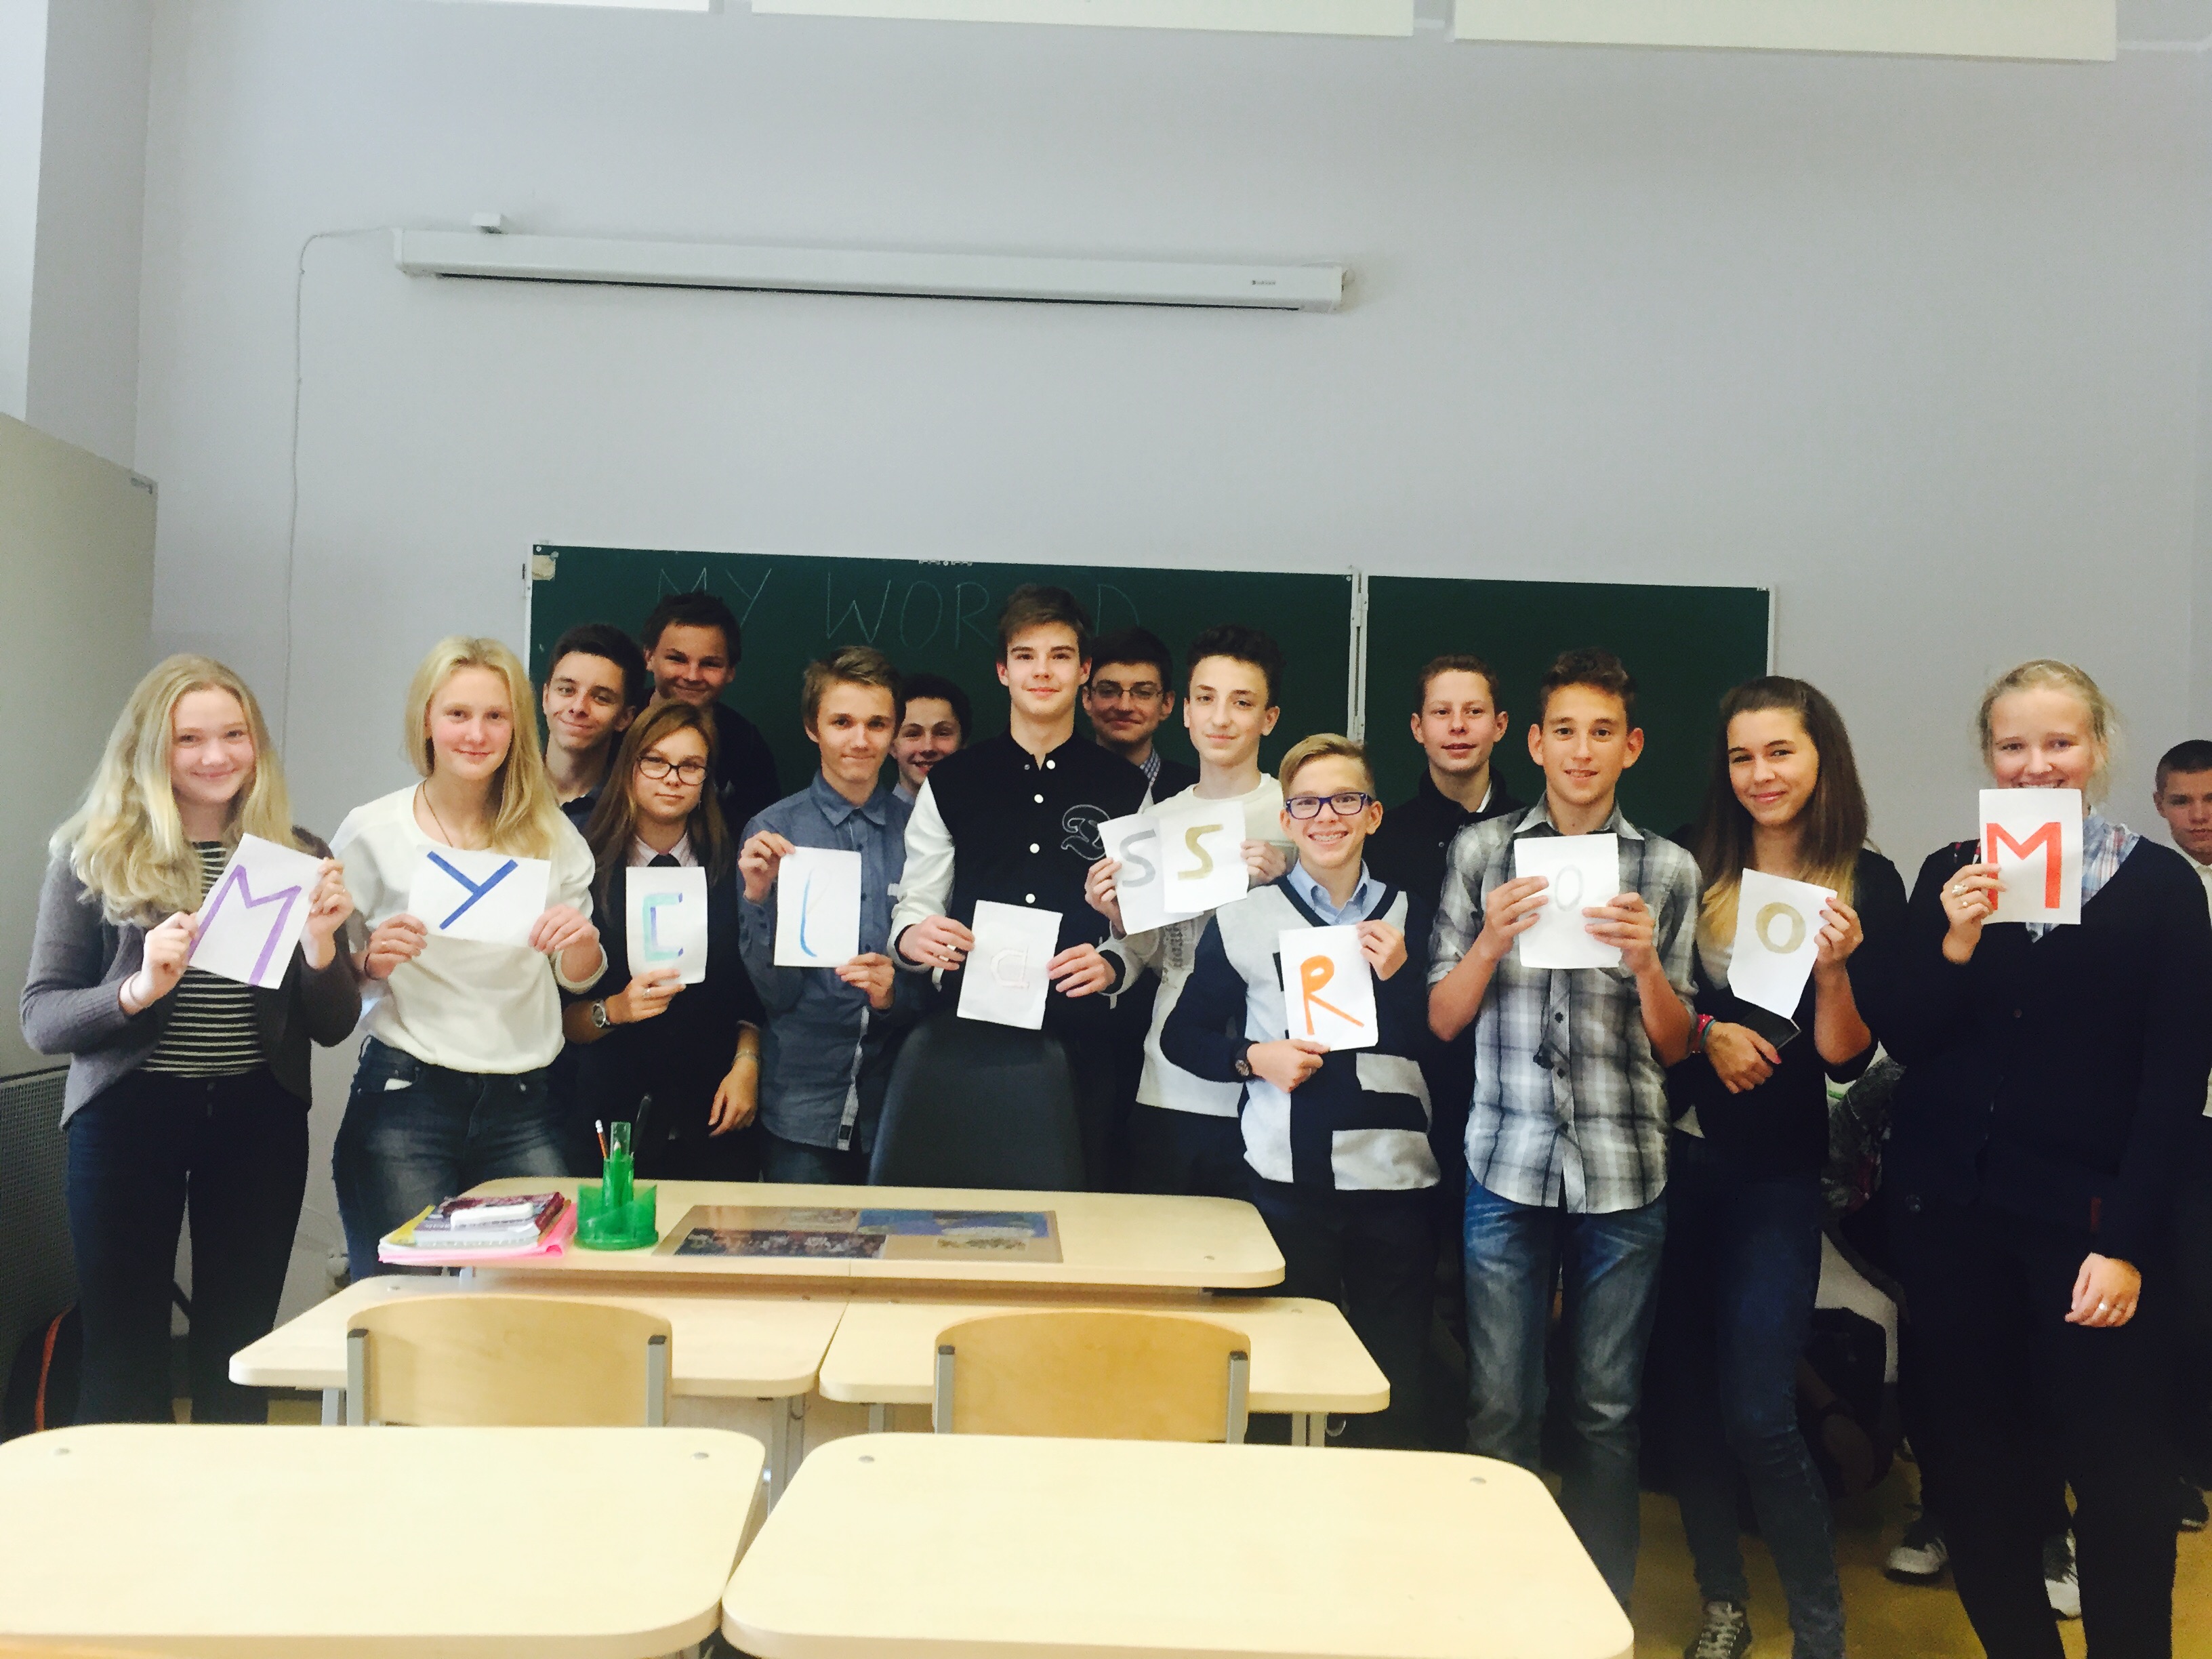
It is our team :) And we are glad to be with you

The results
a,b.
| |
1970
|
1990
|
2015
|
|
Estonian
|
925 000
|
66%
|
963 000
|
60%
|
910 000
|
70%
|
|
Russian
|
335 000
|
24%
|
475 000
|
30%
|
330 000
|
25%
|
|
Ukranian
|
28 000
|
2%
|
48 000
|
3%
|
23000
|
2%
|
|
Belarussian
|
18 000
|
1%
|
28 000
|
2%
|
12 000
|
1%
|
|
Other
|
94 000
|
7%
|
86 000
|
5%
|
25 000
|
2%
|
|
Total
|
1 400 000
|
100%
|
1 600 000
|
100%
|
1 300 000
|
100%
|
c.


d.
|
|
1970
|
1989
|
2015
|
|
Total
|
1356079
|
1565662
|
1 313 271
|
|
Estonian
|
925157
|
963281
|
907 937
|
|
Russian
|
334620
|
474834
|
330 258
|
|
Ukranian
|
28086
|
48271
|
22 562
|
|
Belarussian
|
18732
|
27711
|
12 215
|
|
Other
|
49484
|
51565
|
28 981
|
e.
| |
Total
|
indigenous population
|
Others
|
|
Estonia(2015)
|
1 313 271
|
907 937
|
69,1%
|
405 335
|
30,9%
|
|
UK(2011)
|
63 181 775
|
52 819 964
|
83,6%
|
10 361 811
|
16,4%
|
|
Finland(2015)
|
5 475 450
|
4 891 219
|
89.33%
|
584 231
|
10,67%
|
f. Until 1992 Estonia was part of the Soviet Union, so there is a very high percentage of other nationalities, compared with Finland and the United Kingdom.
g. In demographics, the world population is the total number of humans living on Earth. As of July 2015 , it was estimated at 7,3 billion. The total population of the United Kingdom, Estonia and Finland is around 70 million. In other words, the population of United Kingdom, Estonia and Finland is equivalent to 1% of the total world population.