For this first team activity, you will need to present the goal you have chosen in an infographic.
What is an infographic /ɪnfəʊˈɡræfɪk/ ?
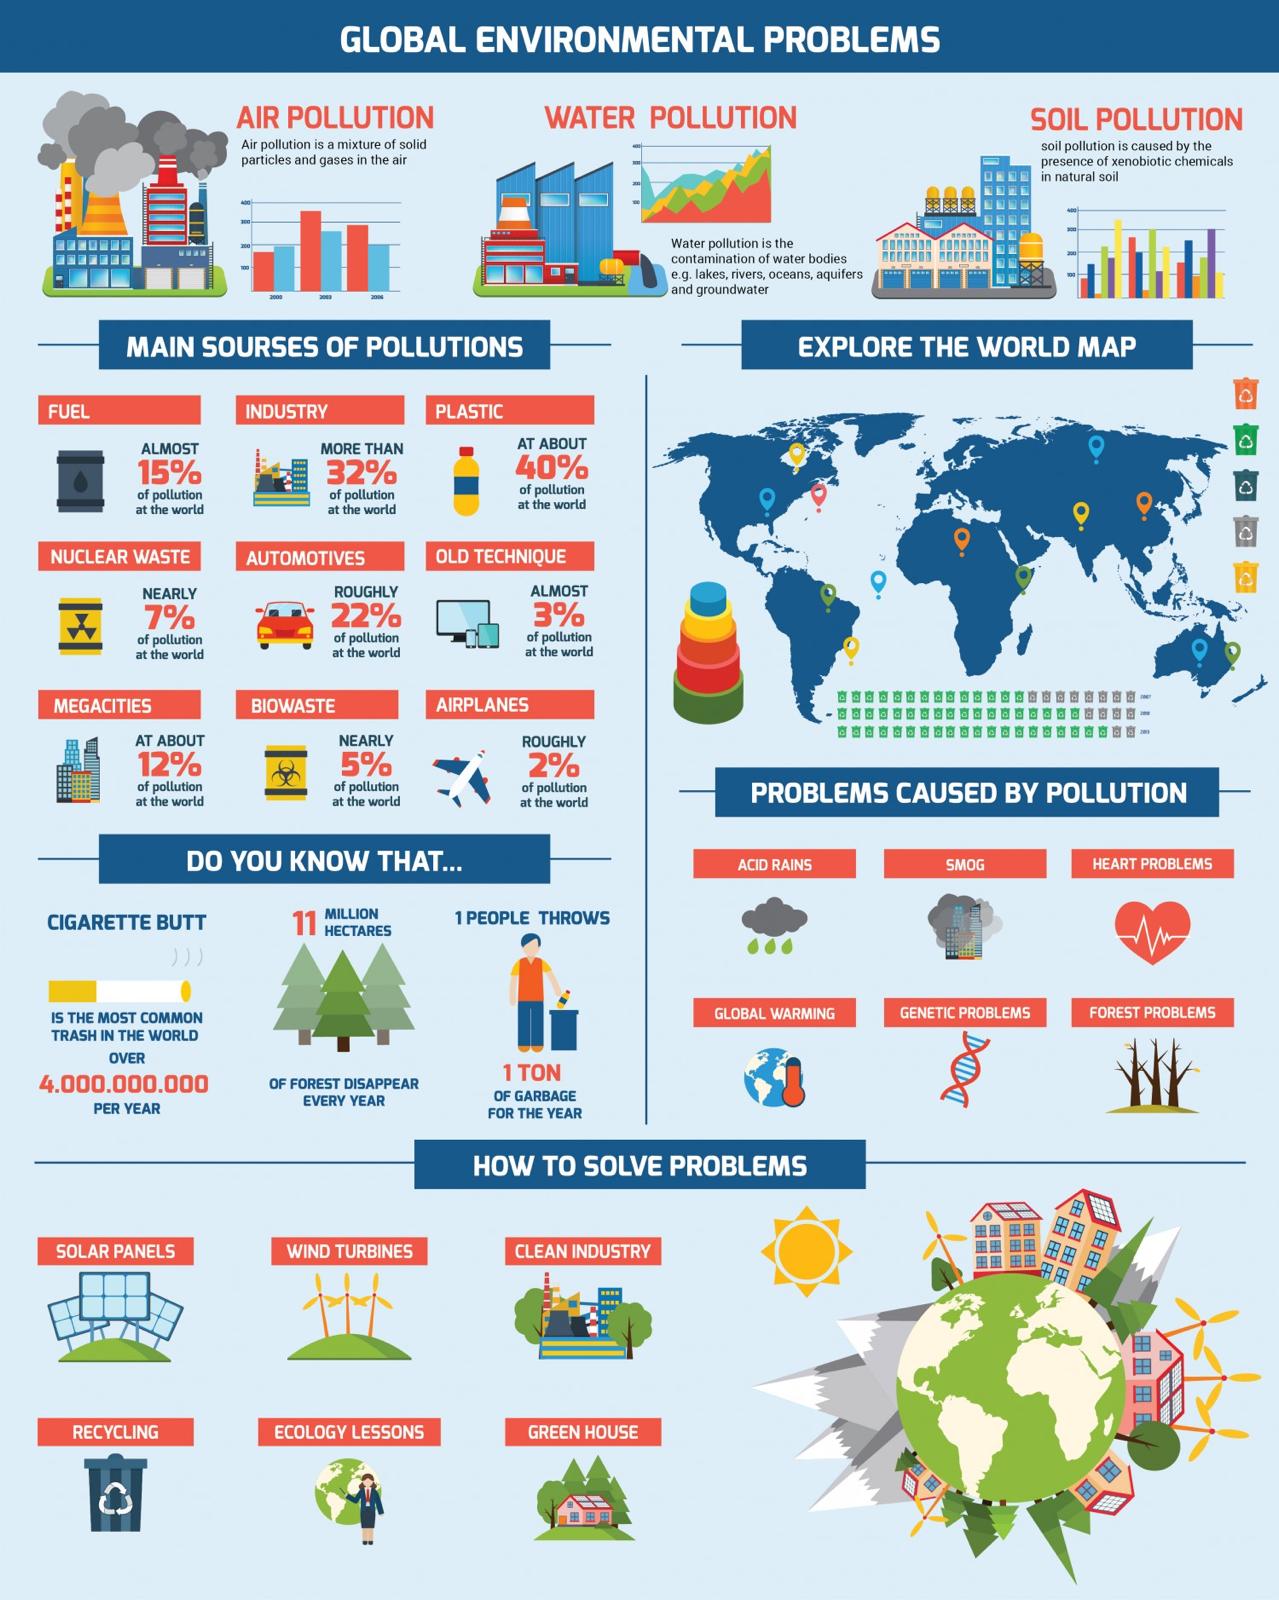
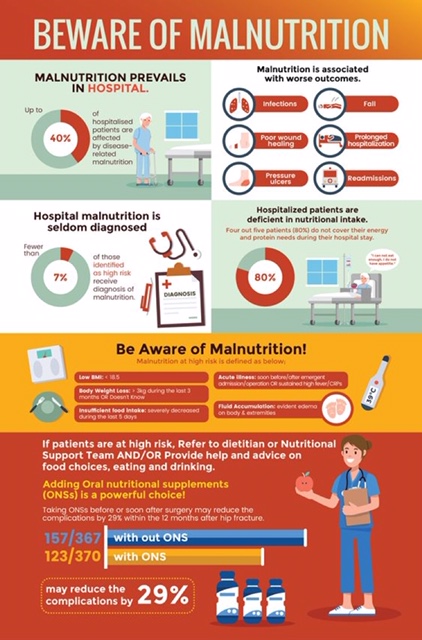
It is a poster that uses graphic elements (charts, diagrams, small images, key data...) to present information in a visually striking way so that it is easy to understand.
Here are two examples:
So, you will need to use your critical thinking skills to organise the information in a clear and coherent way, and also your creative skills to make it visually attractive. What is more, you will need to collaborate efficiently as a team, so: communicate often, be supportive and always be respectful!
How to?
ONE INTERNATIONAL TEAM = ONE INFOGRAPHIC
For teams composed of 6 national groups or more: you can create 2 infographics (select the same template for coherence though).
Go to your team's sub-page. On this page you will find the links to the tools you need to carry out this activity.
Here below is a video of the tool we will use to create the infographics, and read this brochure for more details: https://www.easel.ly/ebook/crashcourseinfographics,
in particular focus on the pro tips given on PAGE 4 (black page), PAGE 6 (green page), PAGE 8 (blue page), PAGE 10 (green page).
And have a look at the LAST PAGE of the brochure: the reference list = the sources! You should also mention the sources of the data you include in your infographic (so write them down on your Google doc).