Didactic Unit:
Building a Fractal with Calc / Excel
By Alfonso Ballesteros González
IES Playamar Spain
1. Introduction
One of the things that I really love of math and in special of fractals are how they are relationated with the real world and the concept of beauty. One example is this beautiful Spleenwort in the picture whose small leaves, reminds the bigger ones.
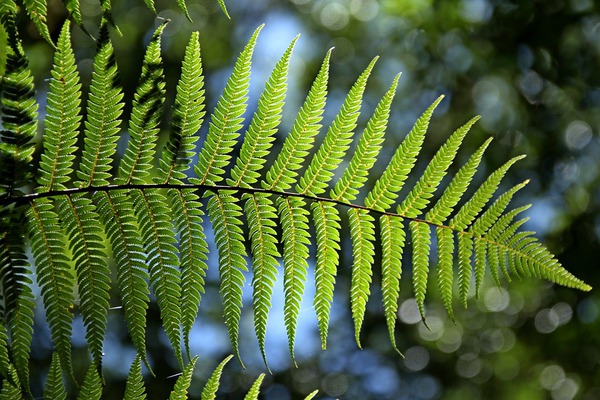
Michael Barnsley described a recursive matrix function which could model the appearance of this bush very properly in his book Fractals Everywhere so this fractal recived its name.
I’m proffesor of office software and I wanted to show my students how the can make this in Calc. (in Excel is the same but you have to change a bit the name of the functions).
In this Didactic unit, we will learn how to create it using the dispersion Graphs of Spreadsheet software like Calc / Excel.
2. Math Theory
Barnsley's fern uses four affine transformations. The formula for the transformation is the following:
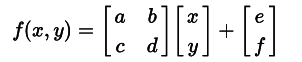
We change the parameters of each a, b, c, d, e and f depending of the functions which is executed which depends of a random probability. Following table parameterizes the values.
| Function Generator | a | b | c | d | e | f | Random Parameter | Probability of the Function |
| ƒ1 generates the Stem | 0 | 0 | 0 | 0.16 | 0 | 0 | <0,01 | 0.01 |
| ƒ2 generates Successively smaller leaflets | 0.85 | 0.04 | −0.04 | 0.85 | 0 | 1.60 | <0,86 | 0.85 |
| ƒ3 generates Largest left-hand leaflet | 0.20 | −0.26 | 0.23 | 0.22 | 0 | 1.60 | <0,93 | 0.07 |
| ƒ4 generates Largest right-hand leaflet | −0.15 | 0.28 | 0.26 | 0.24 | 0 | 0.44 | <1.0 | 0.07 |
So this table means the following
The first function generates the Stem and only happens with a very low probability of 0,1
The second function generates Successively smaller leaflets with a big probability of 0,85
The third function generates Largest left-hand leaflet with a low probability of 0,07
The fourth function generates Largest right-hand leaflet with a low probability of 0,07
When we iterate this matrix 2000-7500 times it appears this wonderful function.
This looks a bit difficult so we are going to convert it in a iterative fuction in next section.
3. Programing it in Calc and getting the data
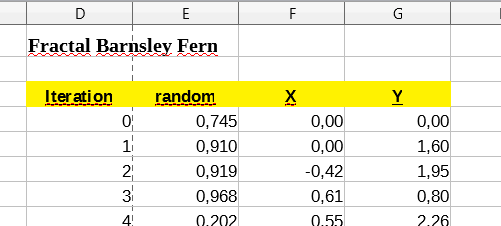
This is a recursive function but to be implemented in spreadsheets i’ve to simulate the iterations , for this purpose, I’ve used the rows of the data base as iterations with four columns
Iteration Column (D5) : Number of Iteration of the Fractal
Iteration0 = 0
Iterationn = 1+Iterationn-1
You will have to fill all this cells before filling the others so that the automatic filling will work in the others. You can do it by filling the D5 cell with = D4+1 . Then copy it and go to selection square and write D6:D7500, press enter to select the 7500 cells and then Ctrl+V (to paste all the functions)
Random Column (E5):
This is a random number generated by the system using the function =Rand() which decides which function is executed each time.
E4 =Rand();
X Column (F5):
It represents the coordinate x of the function which is based in the values of the upper row (which is the last iteration) and the random value which indicates which of the four functions will be executed.
The idea is
X0 = 0
Xn = f(Xn-1,Yn-1) =
If random number <0,01; Function 1 which depends of Xn-1 and Yn-1
If random number <0,86; Function 2 which depends of Xn-1 and Yn-1
If random number <0,93; Function 3 which depends of Xn-1 and Yn-1
If random number <1,00; Function 4 which depends of Xn-1 and Yn-1
Translated to calc is this function is
F5=si.conjunto(
E5<0,01;0;
E5<0,86;0,85*f4+0,04*g4;
E5<0,93;0,2*f4+-0,26*g4;
E5<1;-0,15*f4+0,28*g4)
Y Column (G5):
It represents the coordinate y of the function which is based in the values of the upper row (which is the last iteration) and the random value which indicates which of the four functions will be executed.
The idea is
Y0 = 0
Yn = f(Xn-1,Yn-1) =
If random number <0,01; Function 1 which depends of Xn-1 and Yn-1
If random number <0,86; Function 2 which depends of Xn-1 and Yn-1
If random number <0,93; Function 3 which depends of Xn-1 and Yn-1
If random number <1,00; Function 4 which depends of Xn-1 and Yn-1
Translated to calc is this function is
G5=si.conjunto(
E5<0,01;0,16*G4;
E5<0,86;-0,04*f4+0,85*g4+1,6;
E5<0,93;0,23*f4+0,22*g4+1,6;
E5<1;0,25*f4+0,24*g4+0,44)
Finally we use the wonderful function of automatic filling selecting the first cell and pressing in the black point in the right-down corner.
4. Representing it in Calc
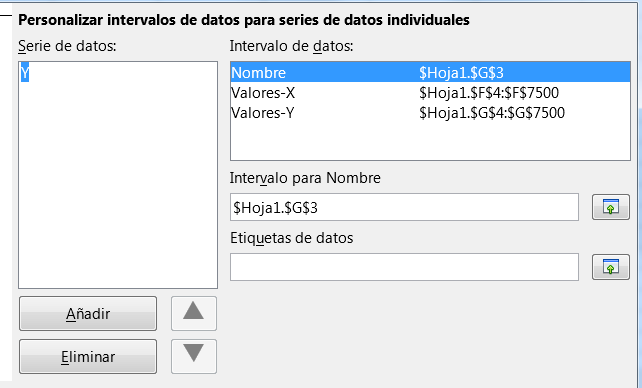
To represent it in calc , we use the XY Dispersion diagram
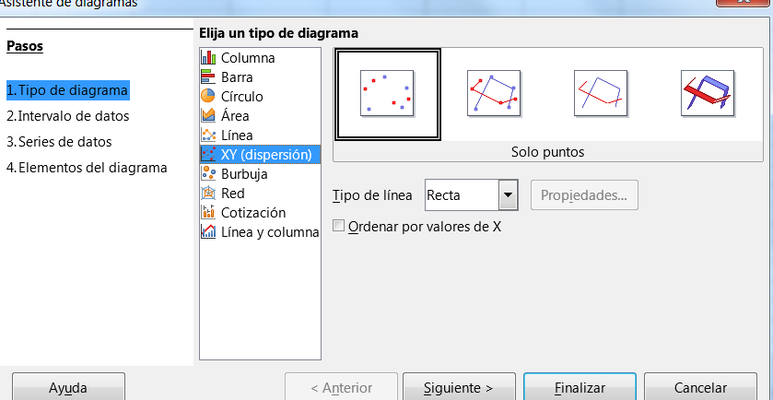
Each Series of this diagram recives the values that we have to set to the X and Y columns
If we have do it properly it should appear a graphic like this one
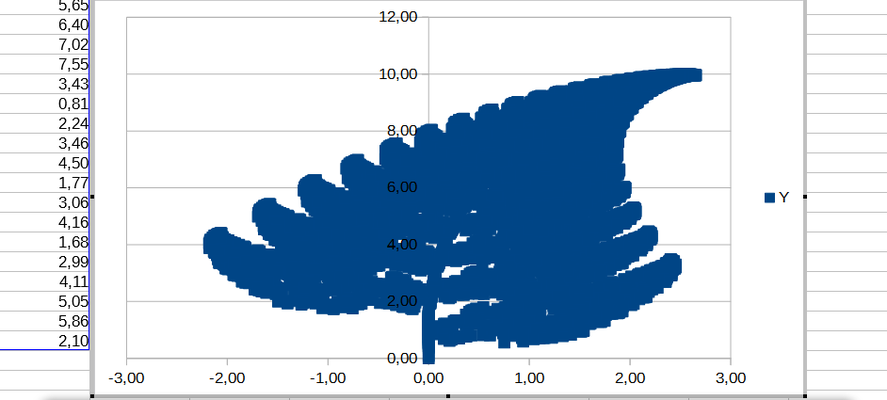
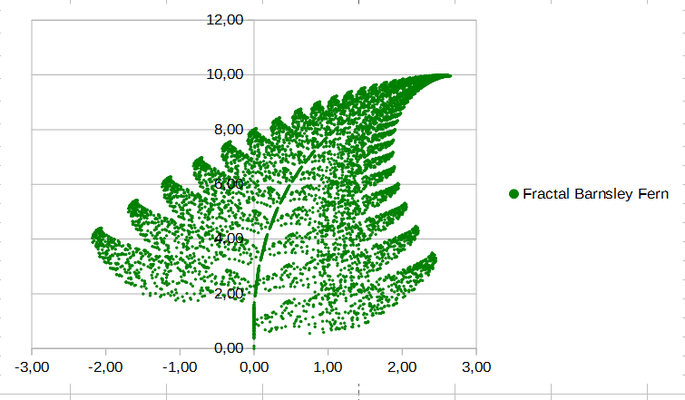
But if we like to see it properly, we should change the size of the point by clicking in one of the points and changing the size to 0,05 cm, also you can change the color to Green (if you don’t want an alien blue plant )
After this you will get this wonderful mathematic model of the nature.
5. Final notes / Downloads
If you want the work done and you have arrived so far reading, you deserve it ¡ and you can find the made Calc file in the site of the Etwinning Project of this file:
Fractal black spleenwort.zip
If what you want is the PDF file for your students you can find it here
Didactic Unit - Building a Fractal with Calc.pdf
From this lines i would like thanks my Colleage and friend Luminita Moise from the SSCNK school in Bucharest who introduced me in this project, and give me the idea to make this Didactic unit .