
A climo...WHAT??
A climograph is a graph with two factors: measurements of temperature and precipitation (rain). And this gives you an idea of the climate of an area.
So, we are going to do an experiment:
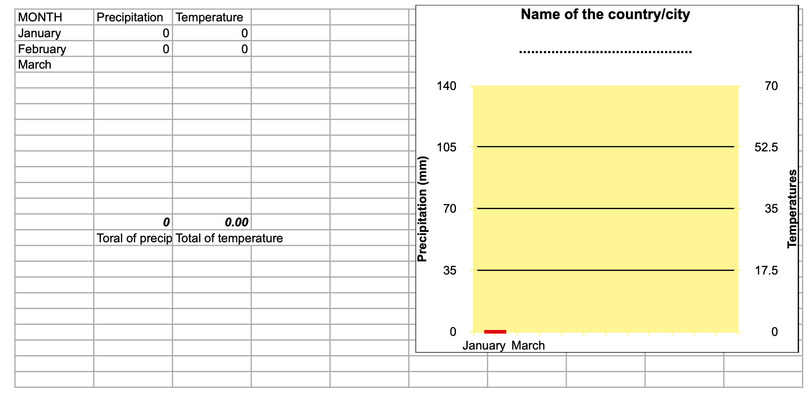
You are going to make a CLIMOGRAPH of your city, writing down the temperature in the morning and the rain for some days (from January to June):
Are our climates different? Do these climates affect our habitats?
You know that the ocean is full of all different and interesting plants and animals (remember the padlet with the underwater plants, animals...per country? PAGE 5). What you find under the water depends on the local conditions, and if those conditions change, then those living things may change too.
But, do you think the climate is different depending on the countries we live in?
Go to the FORUM of your group and discuss the answer with your group! When you agree on a conclusion, post it in the Tricider telling which is the name of your group and the answer! The ones with a complete and correct answer (agreed in the forum) will win 5 CQC!!
http://www.tricider.com/brainstorming/2gt3de1DLet
Let's discover it!
As you have read, to make a climograph you need to measure the precipitations in your city, so, how are you going to do it? YES, you are right! You are going to build up a RAIN METER!
Here you have your sheets to collect your data:
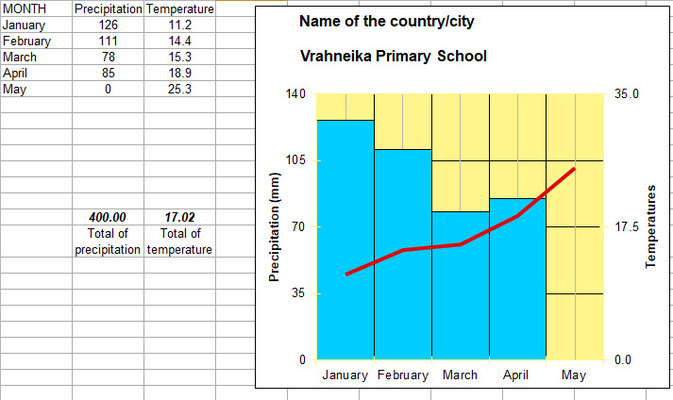
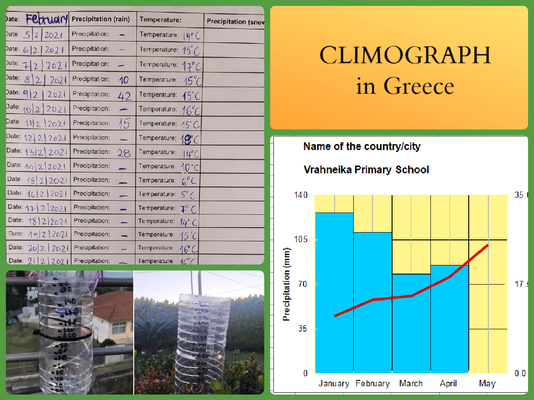
Vrahneika PATRA CLIMOGRAPH OK.xlsx
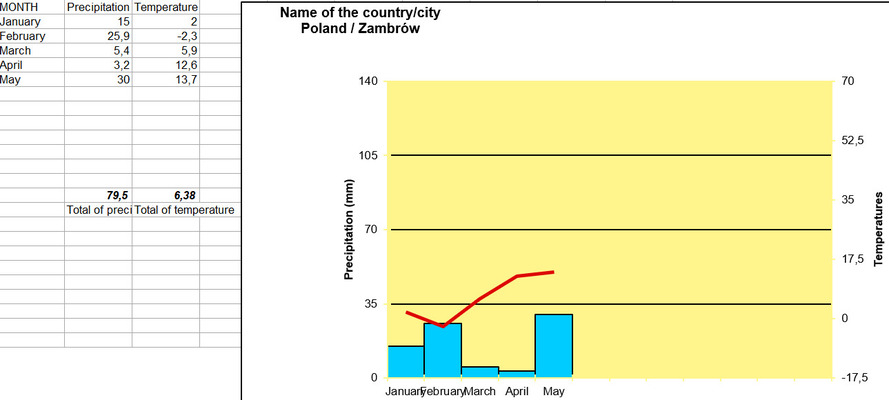
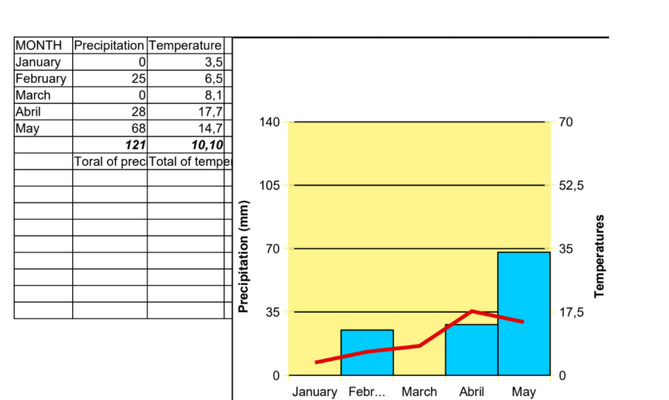
Zambrów-CLIMOGRAPH.xlsx
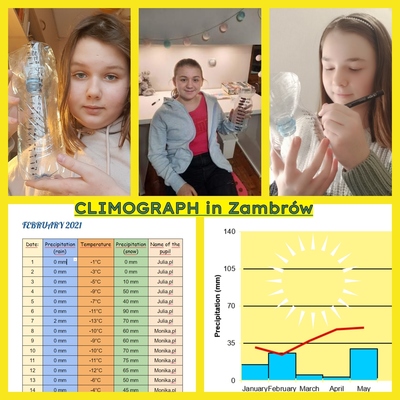
OK CALDES DE MALAVELLA CLIMOGRAPH.xlsx
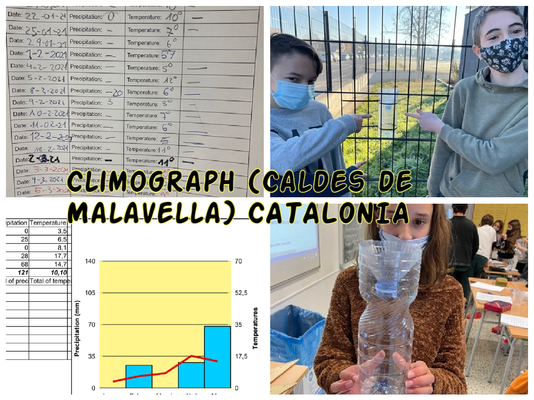
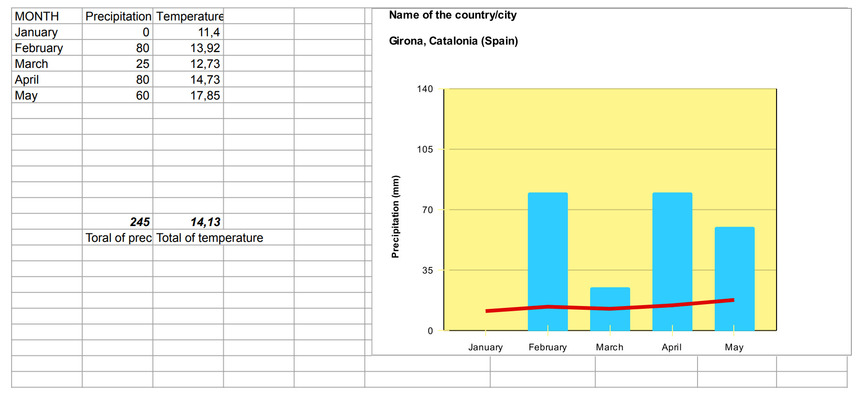
GIRONA, Annexa school CLIMOGRAPH.xlsx
Foggia CLIMOGRAPH OK.xlsx
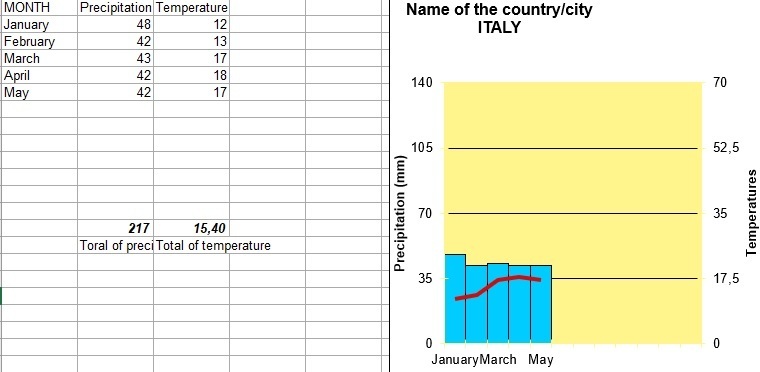
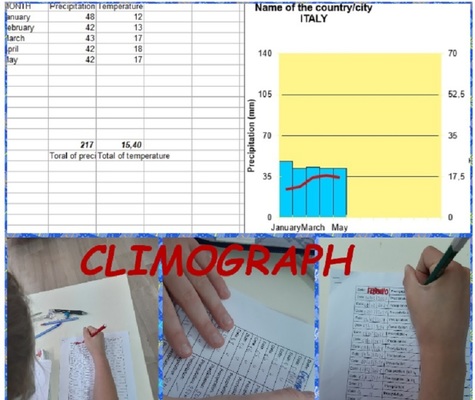
HOWEVER, to do and complete the Climographs you'll need to collect data during a period (from January to May), so, here is a document to collect it:
_Month temperature (eTlantis).pdf
Each month, students have to calculate the avarage of the monthly temperature and presipitations! So, this is a great oportunity to work on it in Maths lessons!
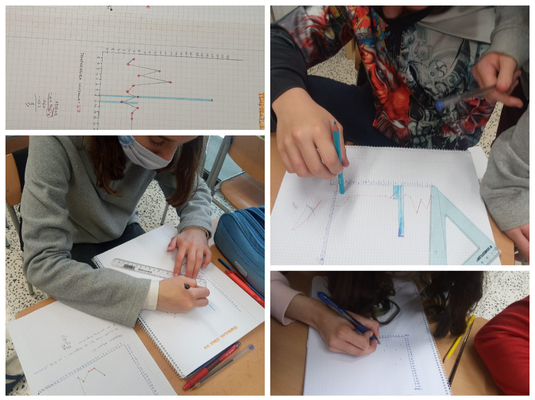
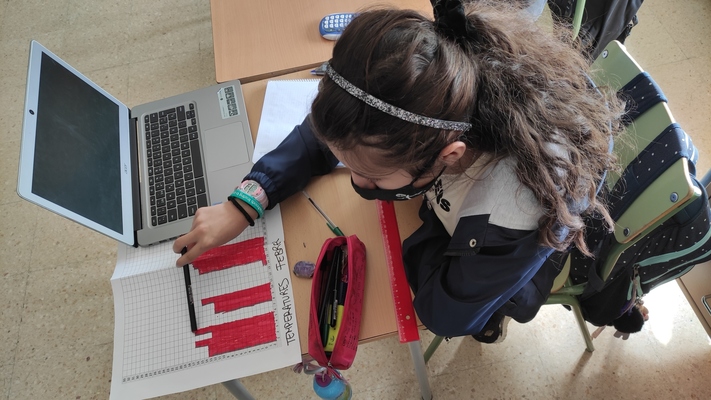
May is over and the students from l'Annexa School have completed the task. This is the result:

f